Get Equation of Linear Trend Line in R (Example)
In this R tutorial you’ll learn how to extract the equation of a linear regression line.
Table of contents:
So now the part you have been waiting for – the example!
Creation of Example Data
First, we need to create some data that we can use in the examples below:
set.seed(238679)                   # Create example data
data <- data.frame(x = 1:100,
                   y = round(1:100 + rnorm(100, 10, 10), 2))
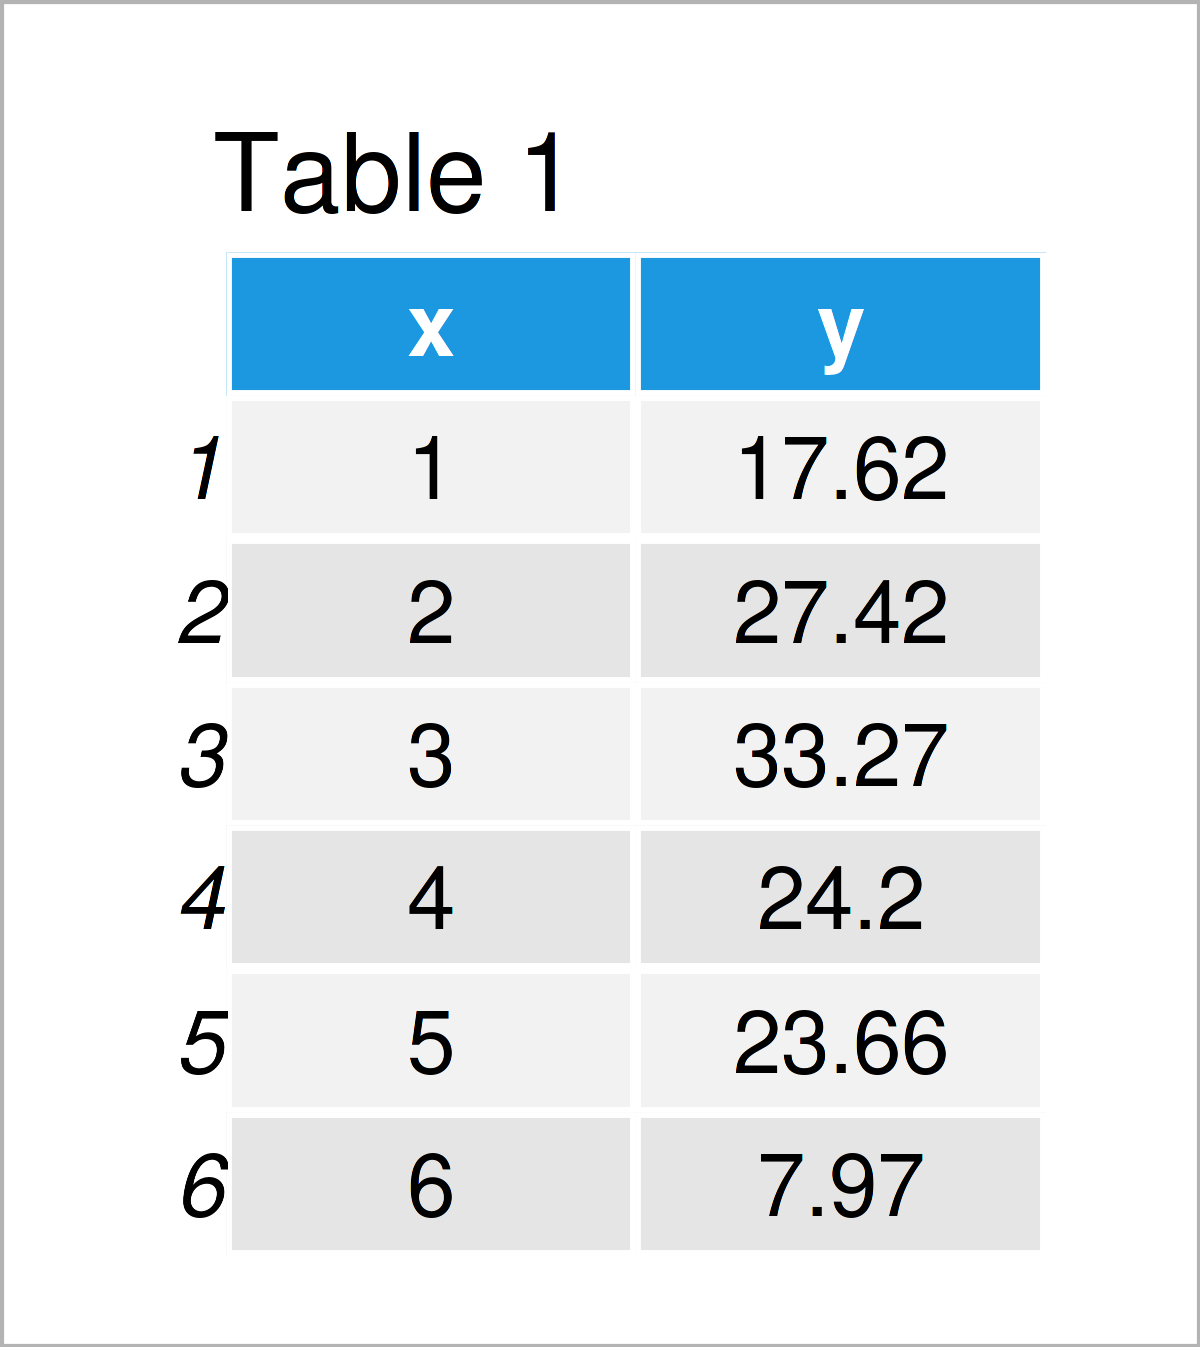
head(data)                         # Print example data

Have a look at the previous table. It shows the first six rows of our example data, and that our data is composed of the two columns “x” and “y”.
Next, we can draw our data:
plot(data$x,                       # Draw line plot of data
     data$y,
     type = "l")

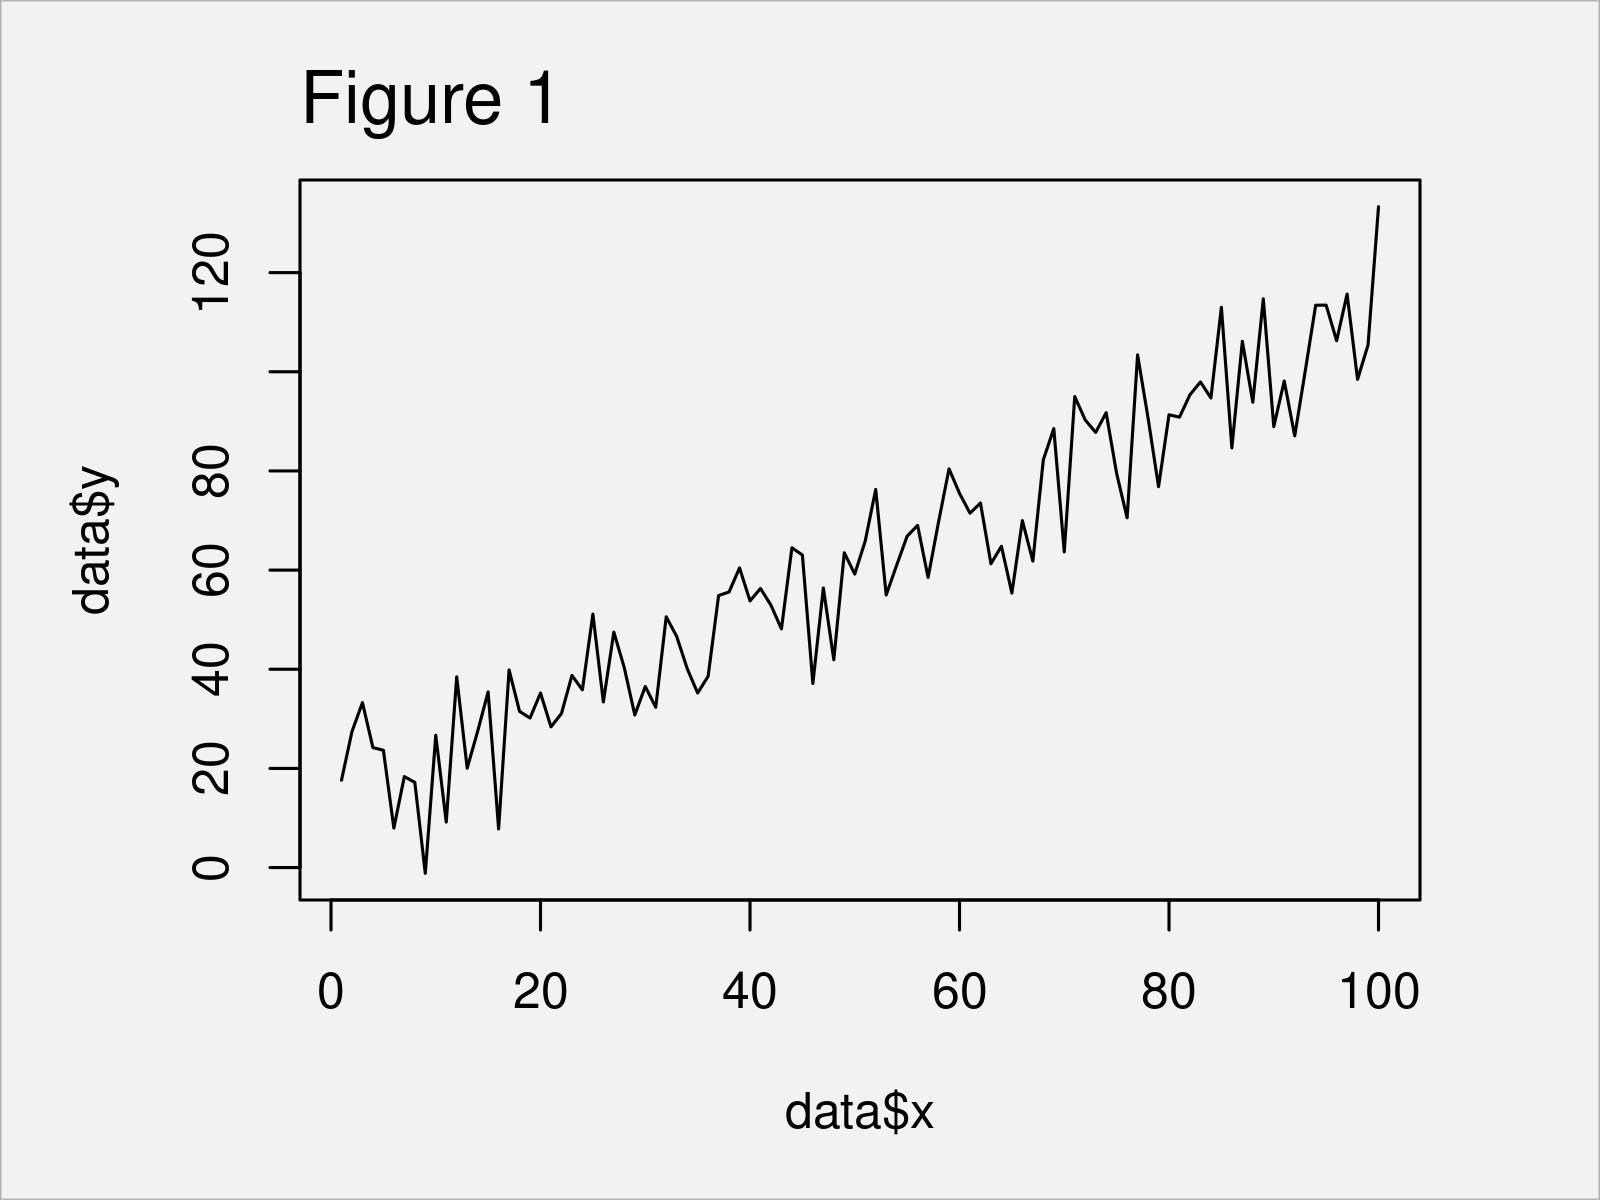
After running the previous R programming code the line plot shown in Figure 1 has been created.
Example: Extract Equation of Linear Regression Line
This example shows how to get the equation of the time trend shown in Figure 1. For this, we first have to estimate a linear regression model:
my_mod <- lm(y ~ x, data) # Estimate linear regression model
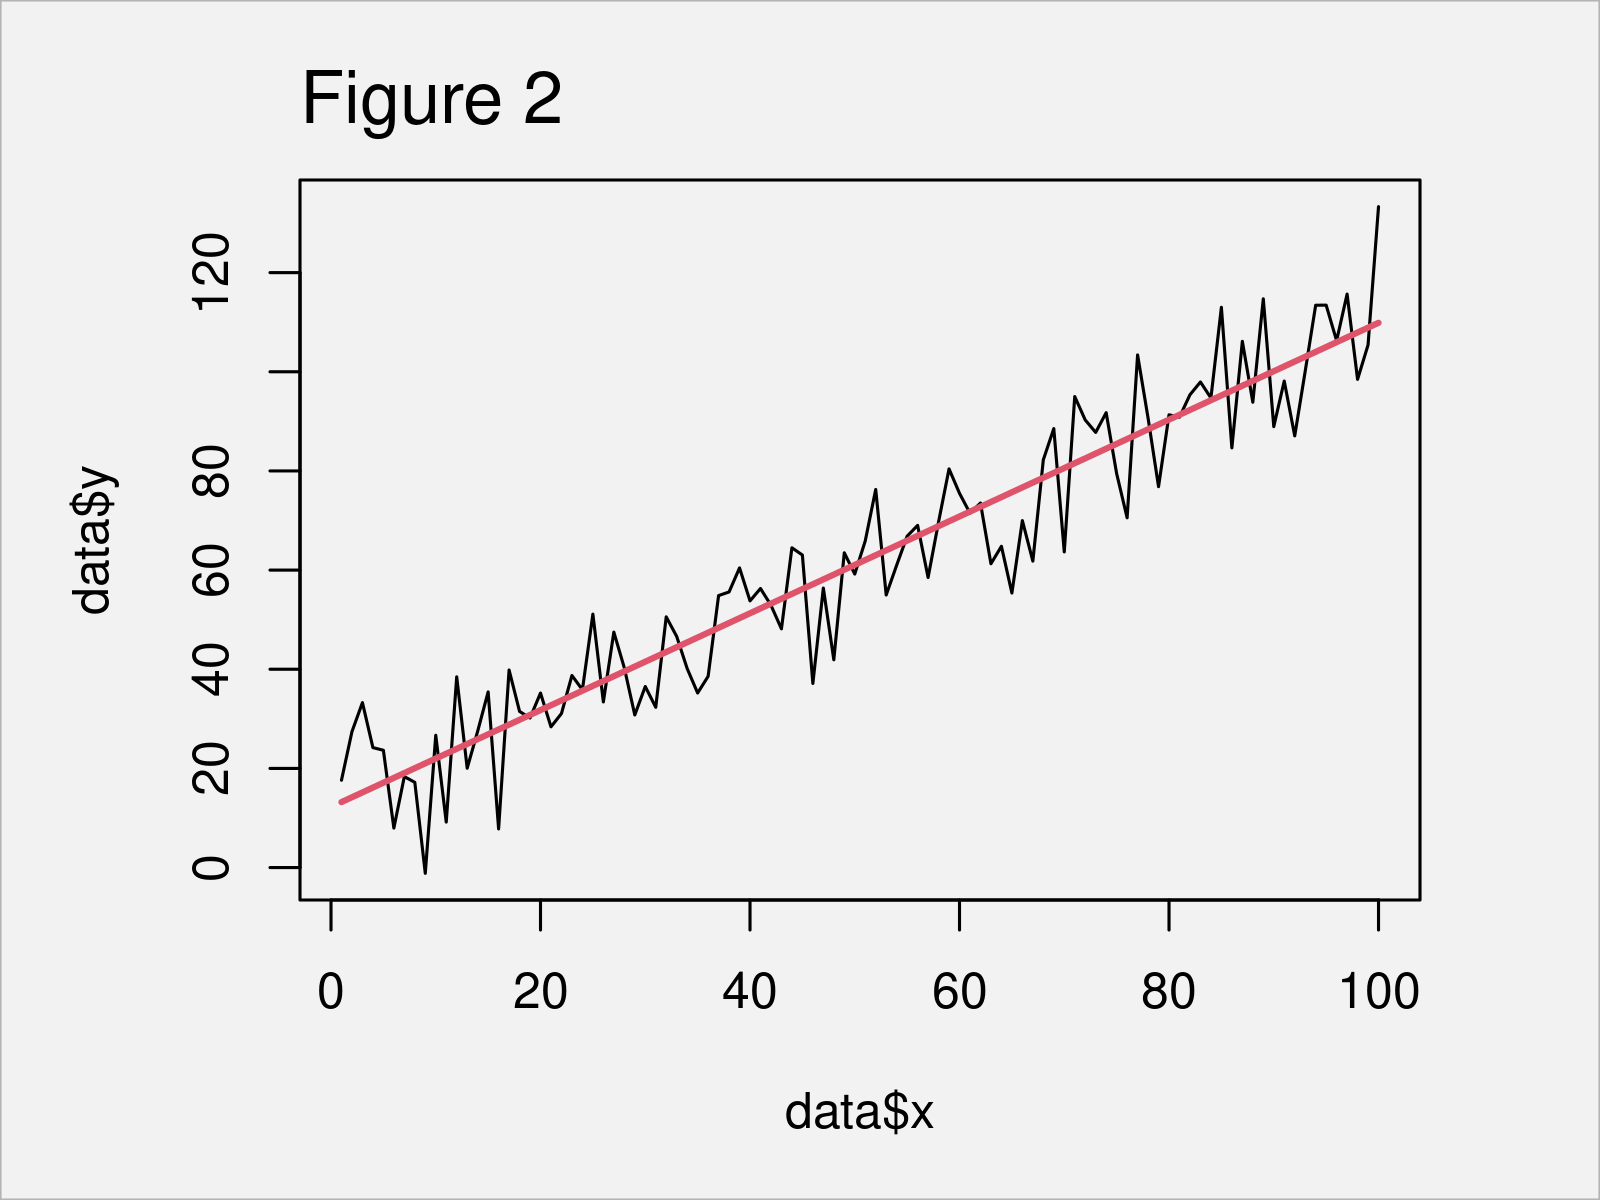
We can visualize the output of our linear regression by adding the regression line to our line plot:
plot(data$x,                       # Draw line plot with regression line
     data$y,
     type = "l")
lines(data$x,
      predict(my_mod),
      col = 2,
      lwd = 2)

The output of the previous R code is shown in Figure 2 – We have created a line trend plot with a straight regression line.
Next, we can extract the coefficients of our model using the coef function:
my_coef <- coef(my_mod)            # Extract coefficients of model
my_coef                            # Print coefficients of model
# (Intercept)           x
#  12.2356788   0.9764044
The previous output shows the intercept and the regression coefficient of our variable x.
Next, we can use these model estimates to print our equation using the paste function:
my_equation <- paste("y =",        # Extract equation of model
                     coef(my_mod)[[1]],
                     "+",
                     coef(my_mod)[[2]],
                     "* x")
my_equation                        # Print equation of model
# [1] "y = 12.2356787878787 + 0.976404380438045 * x"
Have a look at the previous output: It shows the equation of the linear regression line that we have estimated before.
Video & Further Resources
I have recently published a video on my YouTube channel, which shows the R syntax of this article. Please find the video below.
Furthermore, you might want to have a look at some of the other tutorials on my website.
- Add Regression Line to ggplot2 Plot
- Fit Smooth Curve to Plot of Data
- Extract the Intercept from a Linear Regression Model
- Specify Reference Factor Level in Linear Regression
- R Programming Tutorials
In summary: This article has demonstrated how to get the equation of a linear regression slope in R programming. In case you have additional questions, please let me know in the comments.


4 Comments. Leave new
Hello! can I write this “12.2356787878787” in this format “12.23”
“digits” function not working
Hello Zulfiya,
I think it’s better to use the round() function. Using the digits argument with the options() function would change the global settings. See the example with the round function below.
Best,
Cansu
Super. Thank you
Welcome!