Find Unique Values & Rows in data.table in R (2 Examples)
In this article, I’ll explain how to get unique rows or values from a data.table object in R programming.
The article consists of two examples for the display of singular rows and values in a data.table object. To be more specific, the tutorial consists of this:
Let’s dive right into the exemplifying R code!
Example Data & Packages
We first have to install and load the data.table package:
install.packages("data.table")                                # Install data.table package
library("data.table")                                         # Load data.table package
We use the data below as a basis for this R programming tutorial:
dt_all <- data.table(x = rep(c("a", "b", "c"),     each = 3),
                     y = rep(c(1, 2, 3),           each = 3),
                     z = rep(c(TRUE, FALSE, TRUE), each = 3))  # Create data.table
head(dt_all)                                                   # Print head of data

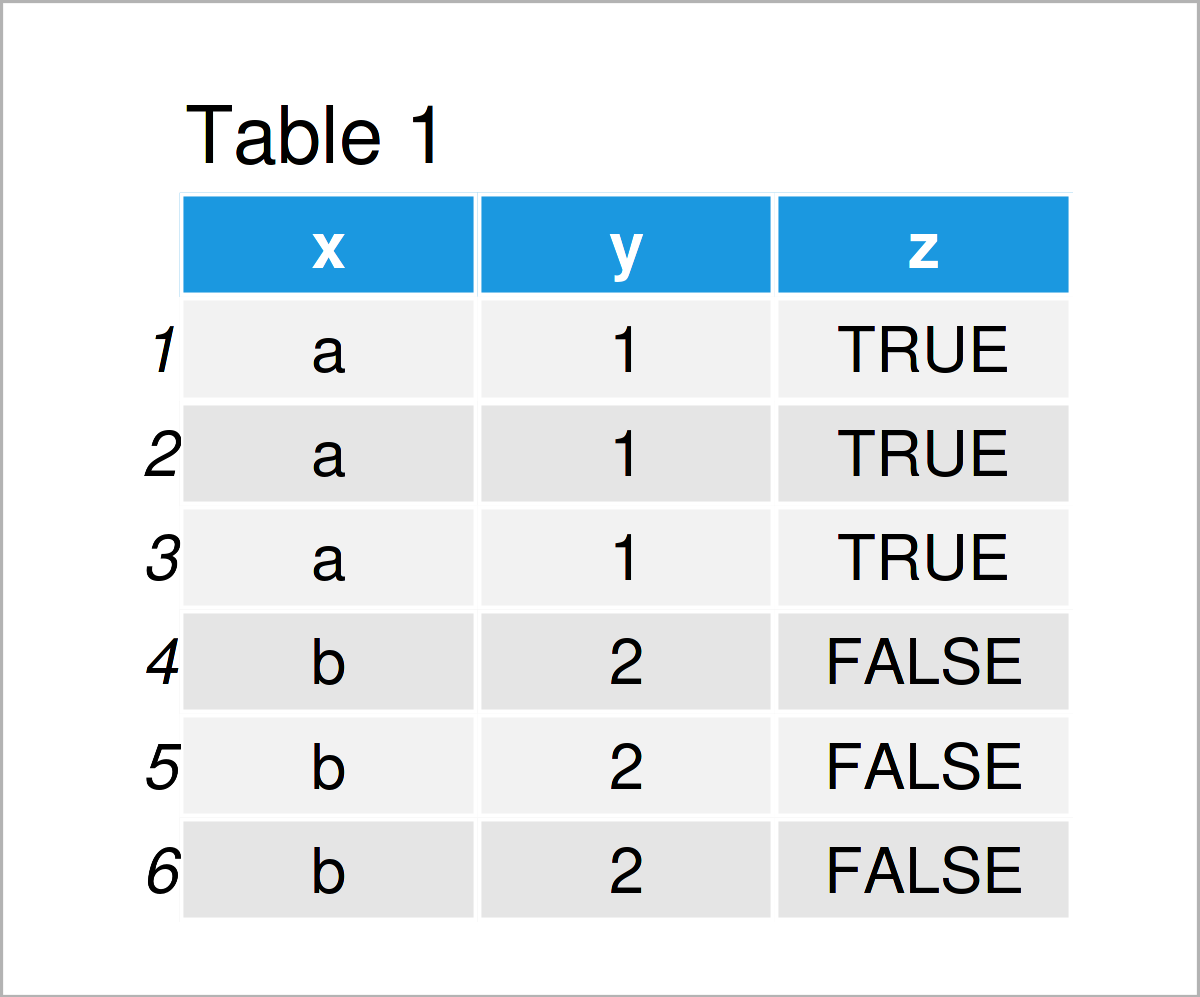
Have a look at the previous table. It shows the head of our example data, and that our data is composed of three columns.
Example 1: Unique Rows
From Table 1 we see that there are duplicate rows in our example data. The following R code displays how to shrink the dataset such that only unique rows remain.
For this task, we can use the unique function:
dt_uni <- unique(dt_all)                                      # Data with unique rows
dt_uni

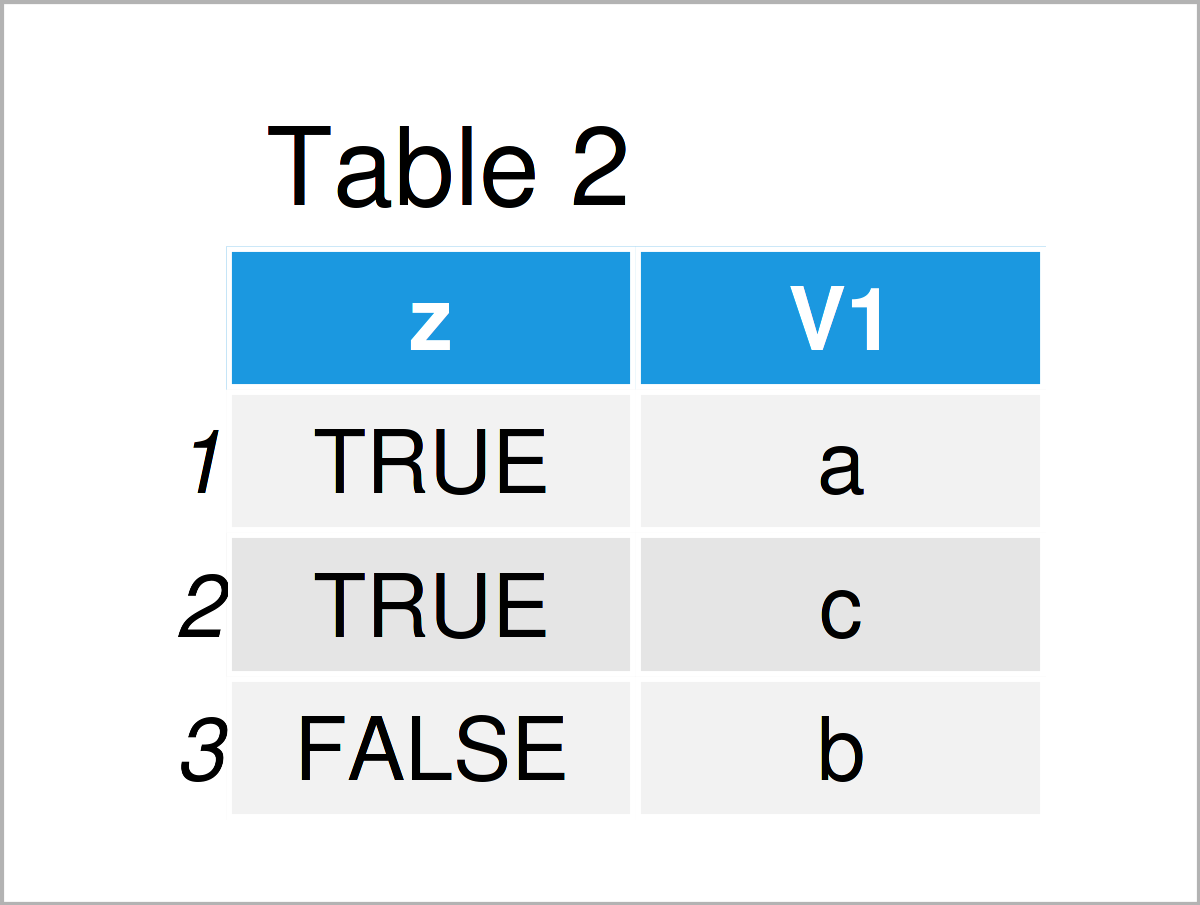
Table 2 shows the unique data rows of Table 1. To put it differently, with the previous command we deleted all duplicate rows. We can also take a look at the data dimensions to see how they changed after removing the duplicate entries.
dim(dt_all)                                                   # Dimension of original data
# [1] 9 3

dim(unique(dt_uni))                                           # Dimension of data with unique rows
# [1] 3 3
Example 2: Unique Row and Column Values
This example explains how to get the unique values for the combinations of certain columns. With the code below, we display the unique values of variable x for all unique values of variable z. For that, we use the by-argument in data.table.
dt_all[, unique(x)]                                           # Get the unique values of variable x
# [1] "a" "b" "c"

dt_all[, unique(x), by = z]                                   # Get the unique values of variable x by the values of variable z

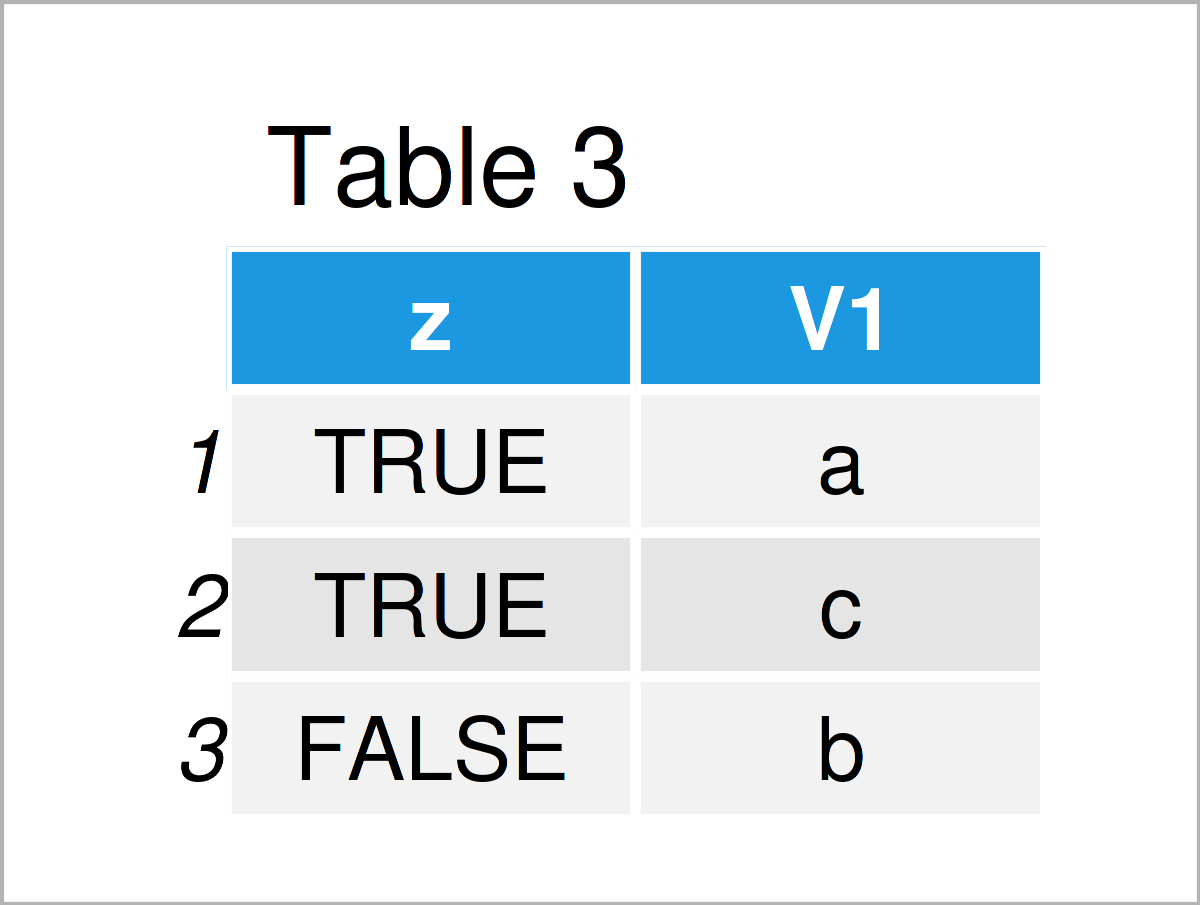
In Table 3 you can see the result of the above code, a data.table object displaying the unique values of x for each value of z.
Video & Further Resources
If you need further info on the R syntax of this article, I recommend watching the following video that I have published on my YouTube channel. In the video, I’m explaining the contents of this page:
The YouTube video will be added soon.
Furthermore, you could have a look at the related tutorials on my website:
- Sort Rows of data.table in R
- Select Data Frame Rows where Column Values are in Range
- Count Unique Values by Group in R
- ggplot2 Warning Message: Removed rows containing non-finite values
- Find Unique Values in List in R
- All R Programming Examples
In this tutorial, you have learned how to shrink a data.table to the unique rows in R programming. In case you have additional questions, don’t hesitate to please let me know in the comments section.
This page was created in collaboration with Anna-Lena Wölwer. Have a look at Anna-Lena’s author page to get further information about her academic background and the other articles she has written for Statistics Globe.


