R Error in hist.default : ‘x’ must be numeric (2 Examples)
In this tutorial, I’ll illustrate how to handle the error in hist.default(X) : ‘x’ must be numeric in R.
The tutorial will contain two examples for the error message “x must be numeric”. To be more specific, the article will contain these content blocks:
Let’s take a look at some R codes in action…
Creation of Example Data
We’ll use the following data as basement for this R tutorial:
set.seed(64982057)                    # Create example data
my_data <- as.character(round(rnorm(200), 2))
my_data                               # Print first values of data
# [1] "-0.1"  "0.65"  "-0.71" "-0.55" "-1.93" "1.69"  "-0.91" "-1.02" "0.28"  "0.3" ...
The previous output of the RStudio console shows the structure of our exemplifying data – It’s a vector of random numbers.
Let’s assume that we want to draw these random numbers in a histogram…
Example 1: Reproduce the Error in hist.default(X) : ‘x’ must be numeric
In this example, I’ll illustrate how to replicate the error message in hist.default(X) : ‘x’ must be numeric.
Consider that we want to apply the hist function to our random data:
hist(my_data)                         # Trying to create histogram
# Error in hist.default(my_data) : 'x' must be numeric
As you can see, the previous R code returned the error in hist.default(my_data) : ‘x’ must be numeric.
The reason for this is that our input data is not numeric. We can check that by using the class function:
class(my_data)                        # Checking class of data
# [1] "character"
Our example data object is a character vector. However, the hist function only takes numeric data as input.
Let’s solve this problem…
Example 2: Fix the Error in hist.default(X) : ‘x’ must be numeric
Example 2 shows how to get rid of the error in hist.default(X) : ‘x’ must be numeric. For this, we have to convert our data from character to numeric:
my_data_num <- as.numeric(my_data)    # Convert character to numeric
my_data_num                           # Print first values of data
# [1] -0.10  0.65 -0.71 -0.55 -1.93  1.69 -0.91 -1.02  0.28  0.30 ...
Now, we can apply the hist function to our updated data:
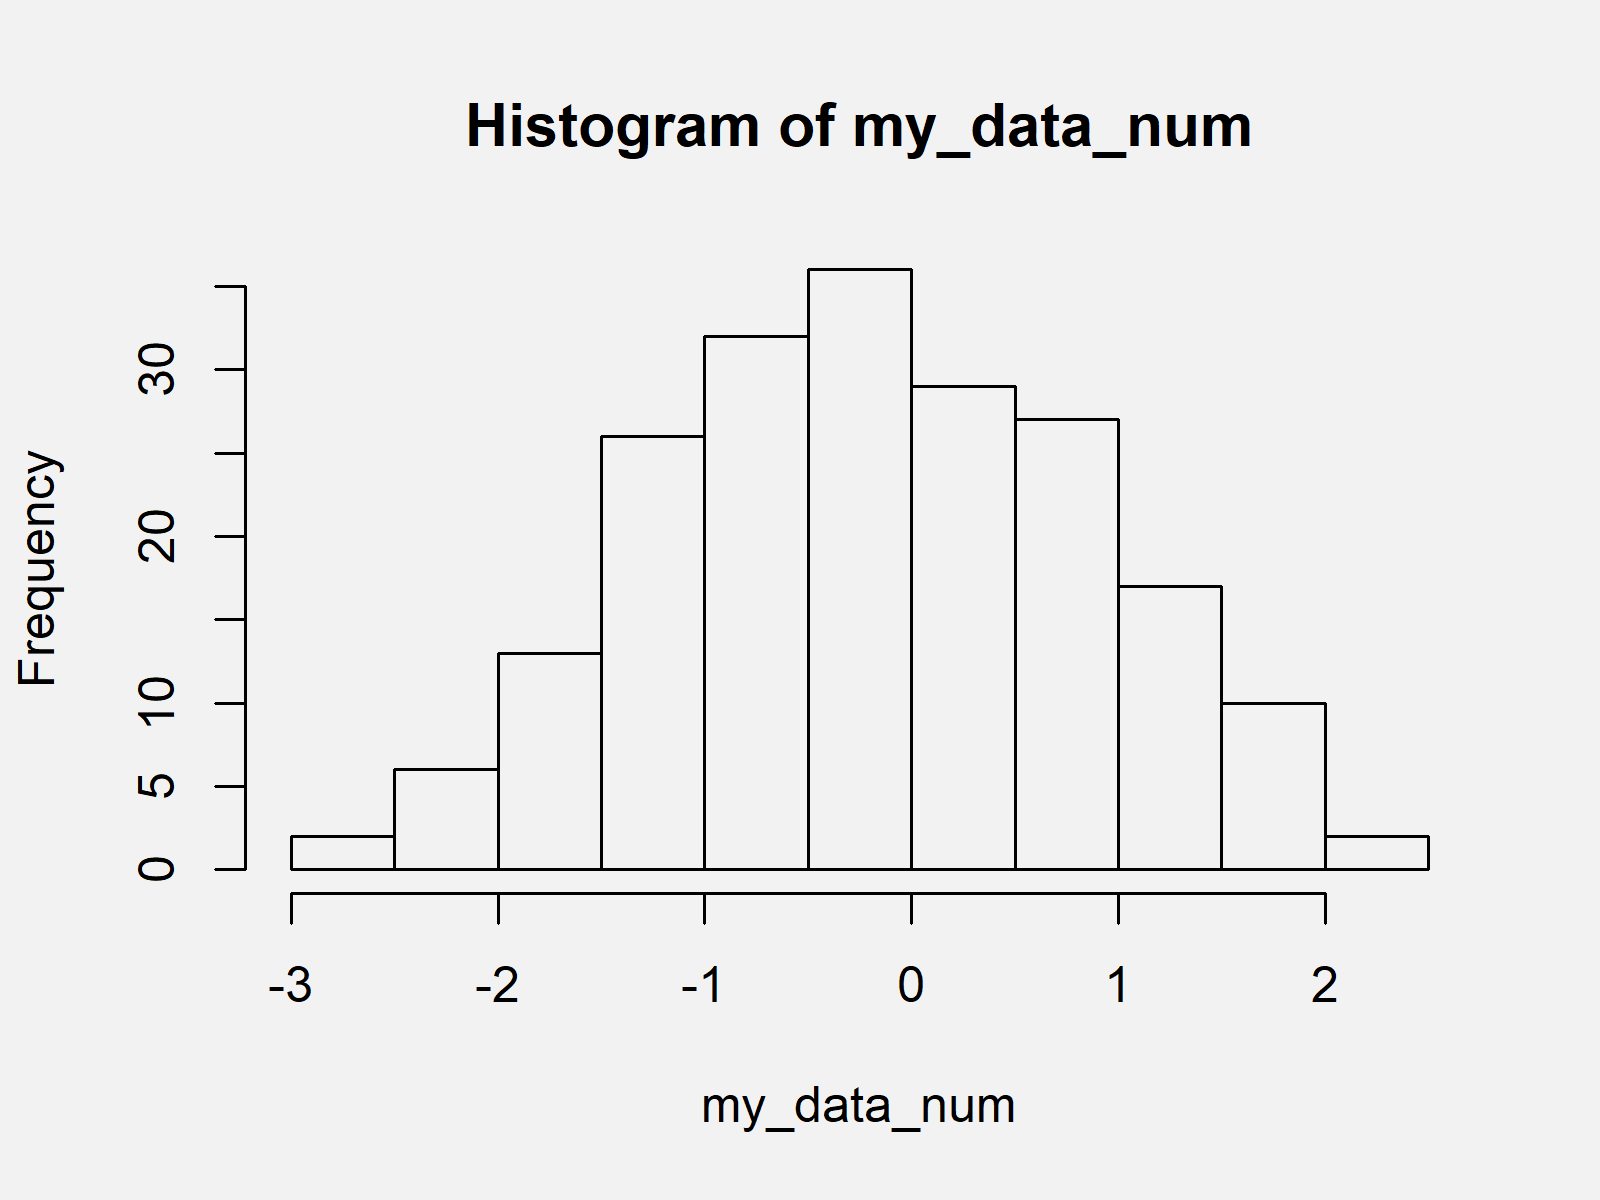
hist(my_data_num) # Draw histogram in R

Figure 1 shows the output of the previous R programming syntax: A histogram created by the hist function of Base R.
Video, Further Resources & Summary
Have a look at the following video of my YouTube channel. In the video, I’m illustrating the contents of this article.
Furthermore, you might read the related tutorials on my website.
In this R post you learned how to deal with the error in hist.default(X) : ‘x’ must be numeric. Please note that this error message can also occur when using other functions that need numeric values as input such as the cor() function when calculating correlations.
In case you have additional questions or comments, let me know in the comments. Furthermore, don’t forget to subscribe to my email newsletter in order to receive updates on new tutorials.


14 Comments. Leave new
My data is already numeric, having a mean and medium, and I am still getting this error.
Hey Trish,
What happens when you use the following R code?
Regards,
Joachim
filter_dat <- filter(myData, age!= "NA")
filter_dat <- as.numeric(filter_dat)
hist(filter_dat)
Hey Macky,
Is this a question, or do you want to share your solution? 🙂
Regards,
Joachim
Hello, i am in need for help.
My data are numeric, everything seems good but i have this error.
if i put “” with my data name, with a class function it says that it is a character, and even if i do the tutorial it doesn’t work. If i do not put the “” on my data name, it says that it cannot be found.
Hey Anissa,
Could you please share your code?
Regards,
Joachim
Hi Joachim, thank you. This is my code on rmarkdown. I can’t have a knit as this line have an error (x is not numeric).
### Exercise 3
“`{r plot-prop-boys-arbuthnot}
hist(arbuthnot$boy_ratio)
plot(arbuthnot$boy_ratio)
“`
What is returned if you execute the following two lines of code?
> class(arbuthnot$boy_ratio)
[1] “numeric”
> head(arbuthnot$boy_ratio)
[1] 0.5270175 0.5215244 0.5187705 0.5210768 0.5159548 0.5109082
Your data looks fine, and if I run your code without the Markdown part it works. So in my opinion this should be a problem due to the Markdown code. Unfortunately, I’m not a Markdown expert, but I have recently created a Facebook discussion group where people can ask questions about R programming and statistics. Could you post your question there? This way, others can contribute/read as well: https://www.facebook.com/groups/statisticsglobe
Thank you Joachim,
I will try with another r markdown code and if it doesn’t help i’ll go on the discussion group.
You are welcome, good luck with solving your problem! 🙂
Hello, I have followed your code and it has worked, however, I now have a lot of NA’s in my data. Is there a way to convert character to numeric without creating NA values please?
class(area_joined_data$Population.density..number.of.usual.residents.per.square.kilometre….note.13.)
[1] “character”
numeric_area_joined_data <- as.numeric(area_joined_data$Population.density..number.of.usual.residents.per.square.kilometre….note.13.)
Warning message:
NAs introduced by coercion
Thank you!
Hello Nancy,
You can check our tutorial: R Warning Message: NAs Introduced by Coercion regarding that specific error. Also, the long comment section where a variety of discussions have taken place. If you still have questions, you can let me know.
Regards,
Cansu