Cumulative Maxima & Minima in R (4 Examples) | cummax & cummin Functions
In this tutorial, I’ll demonstrate how to calculate cumulative maxima and minima using the cummax and cummin functions in the R programming language.
Table of contents:
Let’s dive right in:
Example Data
At the start, we have to create some example data:
set.seed(967834)                             # Create random example vector
x <- round(rnorm(10, 10, 5))
x                                            # Print example vector
#  [1]  8 10  2  6 11  6  3 13 18  1
The previous output of the RStudio console shows the structure of our example data – it’s a vector object containing ten random integer values.
Example 1: Calculate Cumulative Maximum Using cummax() Function
The following R programming syntax shows how to compute a vector of cumulative maxima.
For this, we can apply the cummax function as shown below:
x_cummax <- cummax(x)                        # Apply cummax function
x_cummax                                     # Print cumulative maxima vector
#  [1]  8 10 10 10 11 11 11 13 18 18
As you can see, the previous R code has returned a vector of cumulative maxima.
Example 2: Calculate Cumulative Minimum Using cummin() Function
Similar to the cummax function (as explained in Example 1), we can use the cummin function to calculate cumulative minima of an input vector:
x_cummin <- cummin(x)                        # Apply cummin function
x_cummin                                     # Print cumulative minima vector
#  [1] 8 8 2 2 2 2 2 2 2 1
The previous R code has created a new data object called x_cummin that contains the cumulative minima of our input vector.
Example 3: Create Data Frame Containing Cumulative Max & Min
In Example 3, I’ll show how to store all results of the previous examples in a data frame.
To do this, we can apply the data.frame function as shown in the following R code:
data <- data.frame(x, x_cummax, x_cummin)    # Store results in data frame
data                                         # Print data frame with results

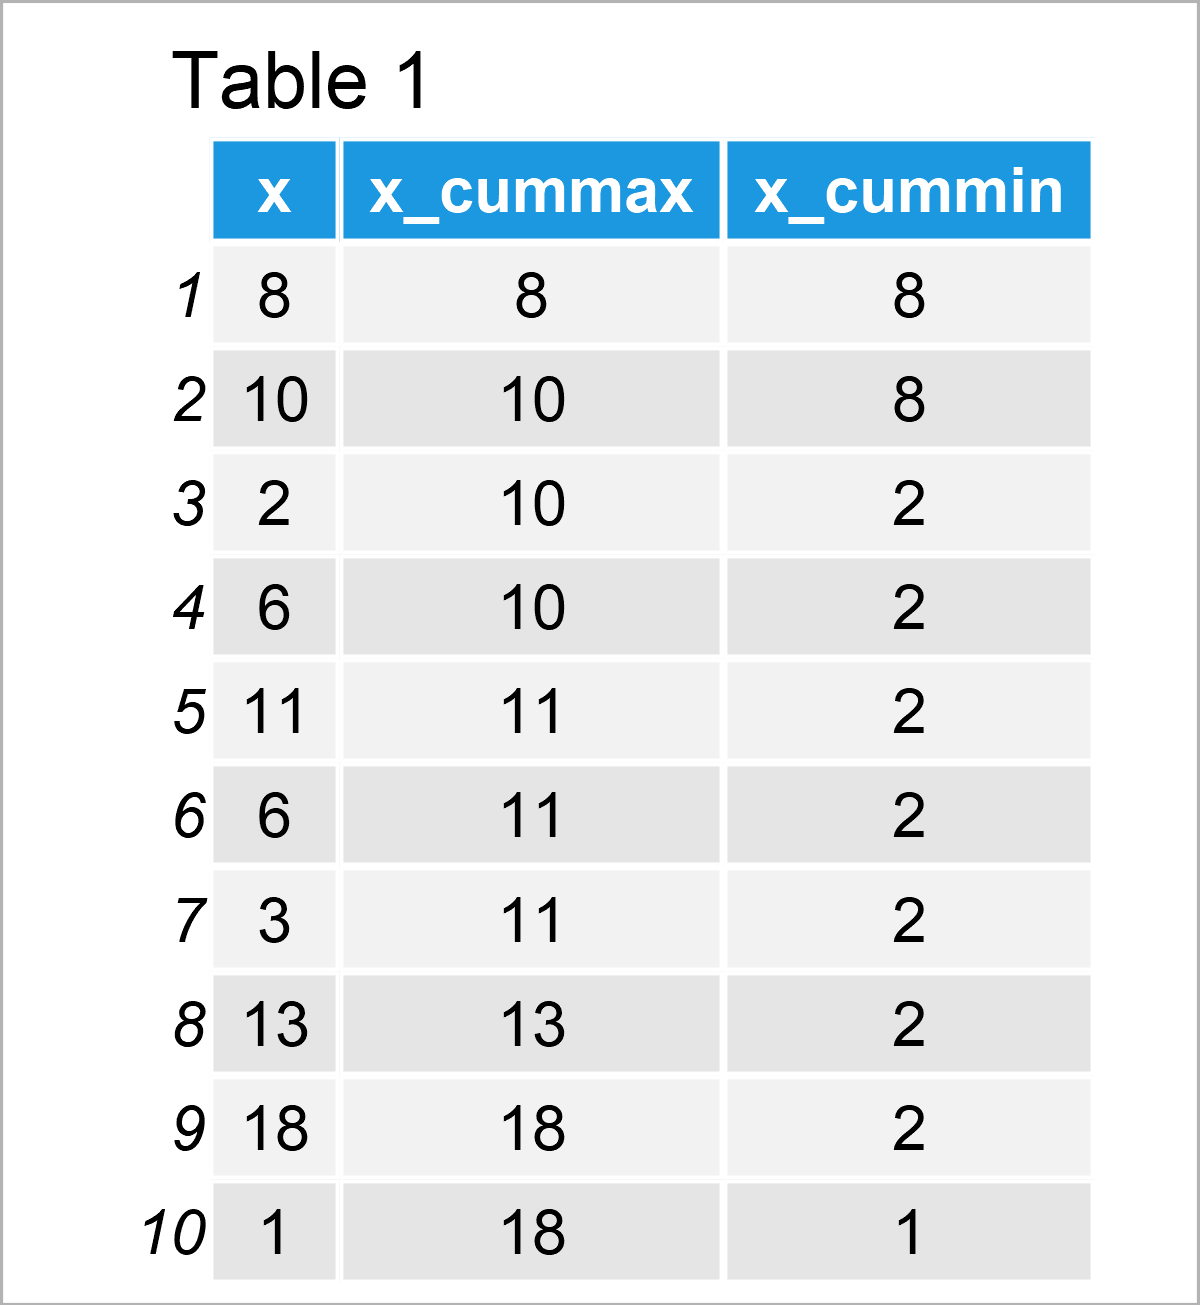
Table 1 visualizes the output of the previous R code, i.e. a data frame containing our input vector x as well as the cumulative maxima and minima in three different columns.
We can also create a long version of this data frame using the tidyr package.
To be able to use the functions and commands of the tidyr package, we first need to install and load tidyr.
install.packages("tidyr")                    # Install & load tidyr package
library("tidyr")
We can now use the pivot_longer function to reshape our data frame from wide to long format:
data_long <- data %>%                        # Convert data frame to long format
  pivot_longer(cols = colnames(data)) %>%
  as.data.frame()
head(data_long)                              # Head of data in long format

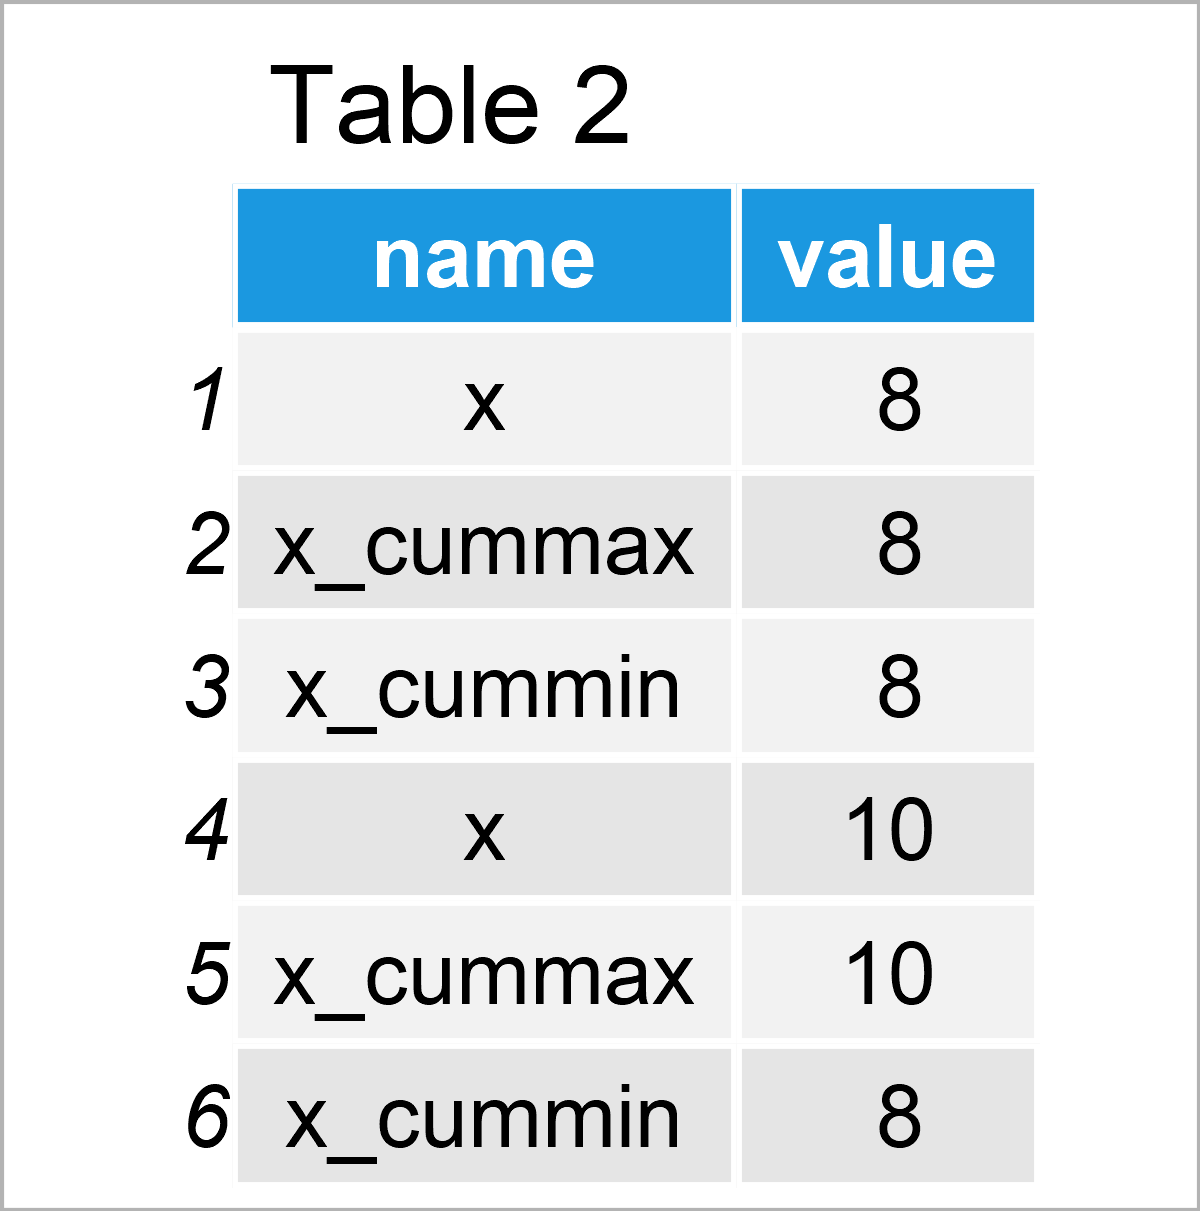
After running the previous R syntax the long data matrix shown in Table 2 has been created.
Example 4: Draw Plot of Cumulative Max & Min
The following syntax illustrates how to draw the cumulative maxima and minima that we have created in the previous examples in a ggplot2 graphic.
First, we need to install and load the ggplot2 package:
install.packages("ggplot2")                  # Install ggplot2 package
library("ggplot2")                           # Load ggplot2
Next, we can draw a line plot with multiple lines based on our long data set:
ggplot(data_long,                            # Draw plot of cumulative max & min
       aes(x = rep(1:(nrow(data_long) / length(table(name))),
                   each = length(table(name))),
           y = value,
           color = name)) +
  geom_line()

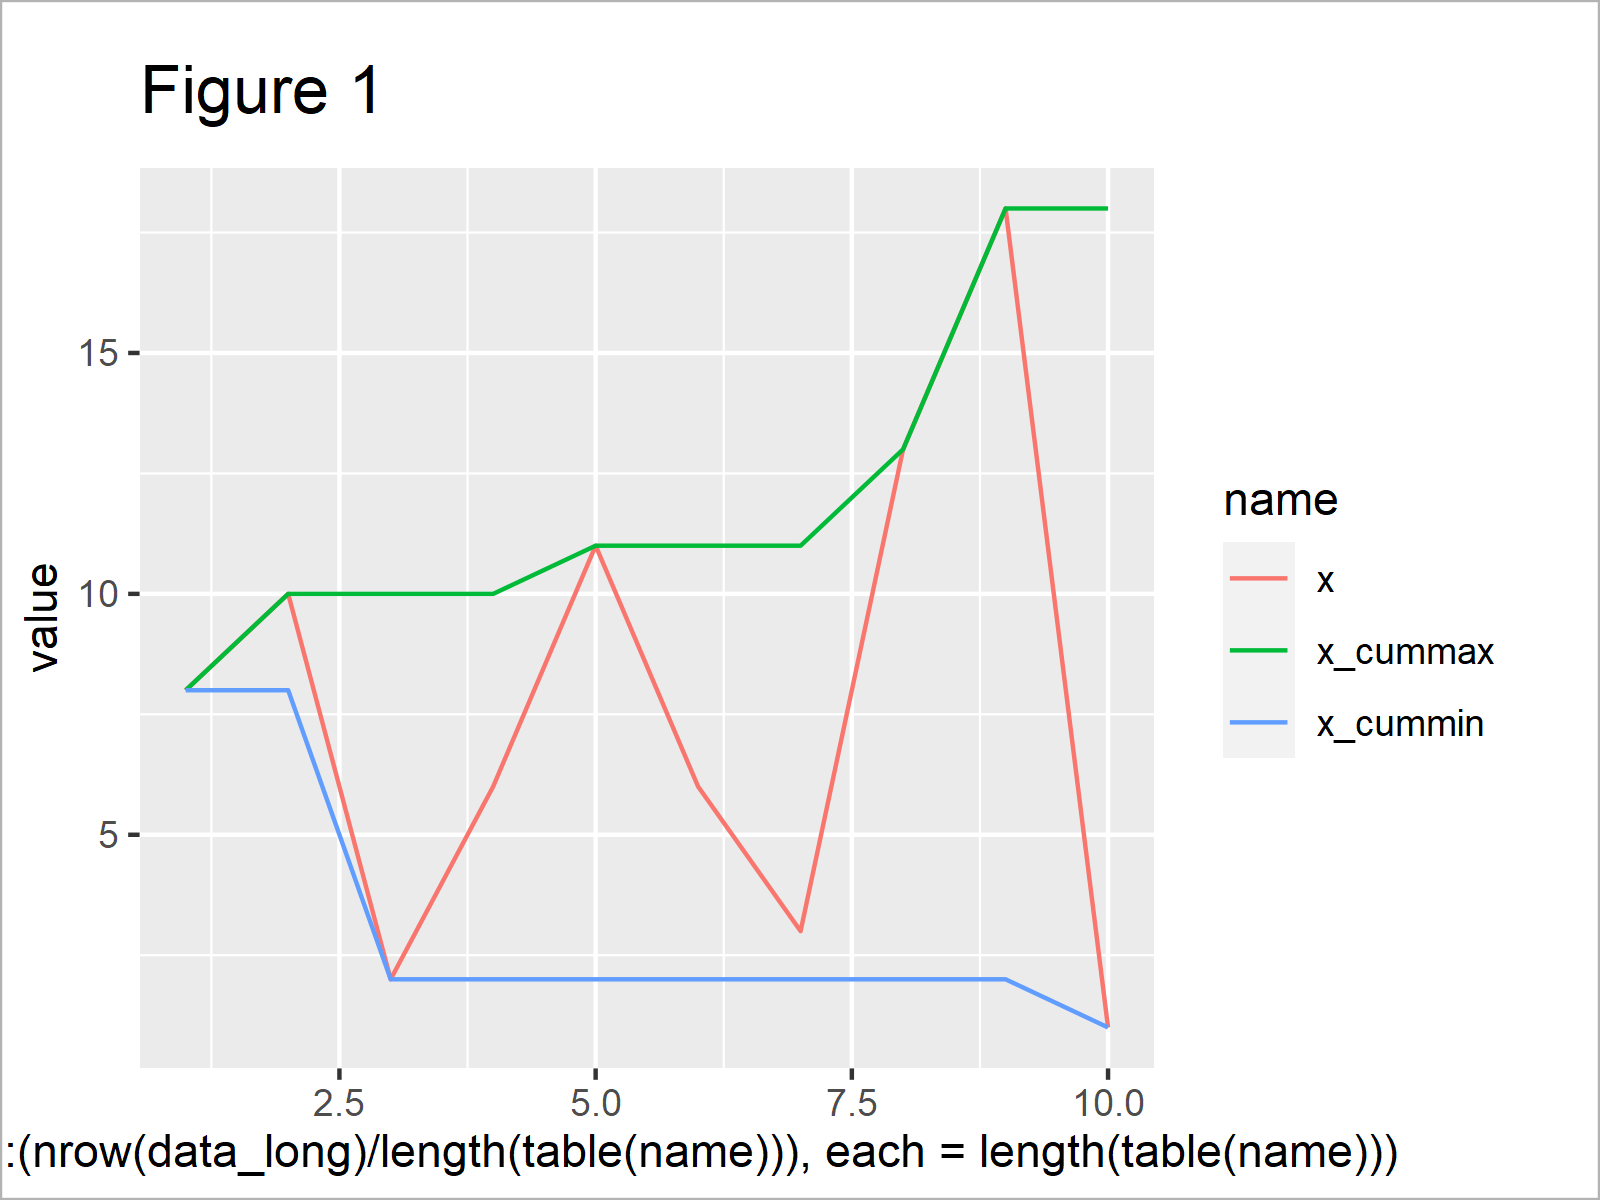
After executing the previous R programming code the line plot shown in Figure 1 has been created. On the right side of the graph, you can see a legend that identifies the different lines, i.e. the cumulative extremes.
Video & Further Resources
Do you need further explanations on the R programming codes of this article? Then you could watch the following video on my YouTube channel. In the video instruction, I explain the R code of this tutorial:
Furthermore, you could read the related articles on my website. Some tutorials can be found below.
- Cumulative Mean in R
- Cumulative Sum in R
- Cumulative Frequency & Probability Table in R
- max and min Functions
- pmax and pmin Functions
- Select Row with Maximum or Minimum Value in Each Group
- Calculate Moving Average, Maximum, Median & Sum of Time Series
- All R Programming Tutorials
In summary: This tutorial has shown how to use the cummax and cummin functions to calculate cumulative extreme values in the R programming language. If you have further questions, don’t hesitate to let me know in the comments section. Besides that, please subscribe to my email newsletter in order to get updates on the newest tutorials.


