Count Non-NA Values by Group in R (2 Examples)
This tutorial illustrates how to get the number of non-NA values by group in R.
Table of contents:
Here’s the step-by-step process:
Example Data
As the first step, we have to construct some data that we can use in the examples below:
data <- data.frame(value = c(5, 5, 6, 2, NA, 2, NA, NA, 2, 2, 4, NA),  # Create data
                   group = rep(LETTERS[1:4], each = 3))
data                                                        # Print example data frame

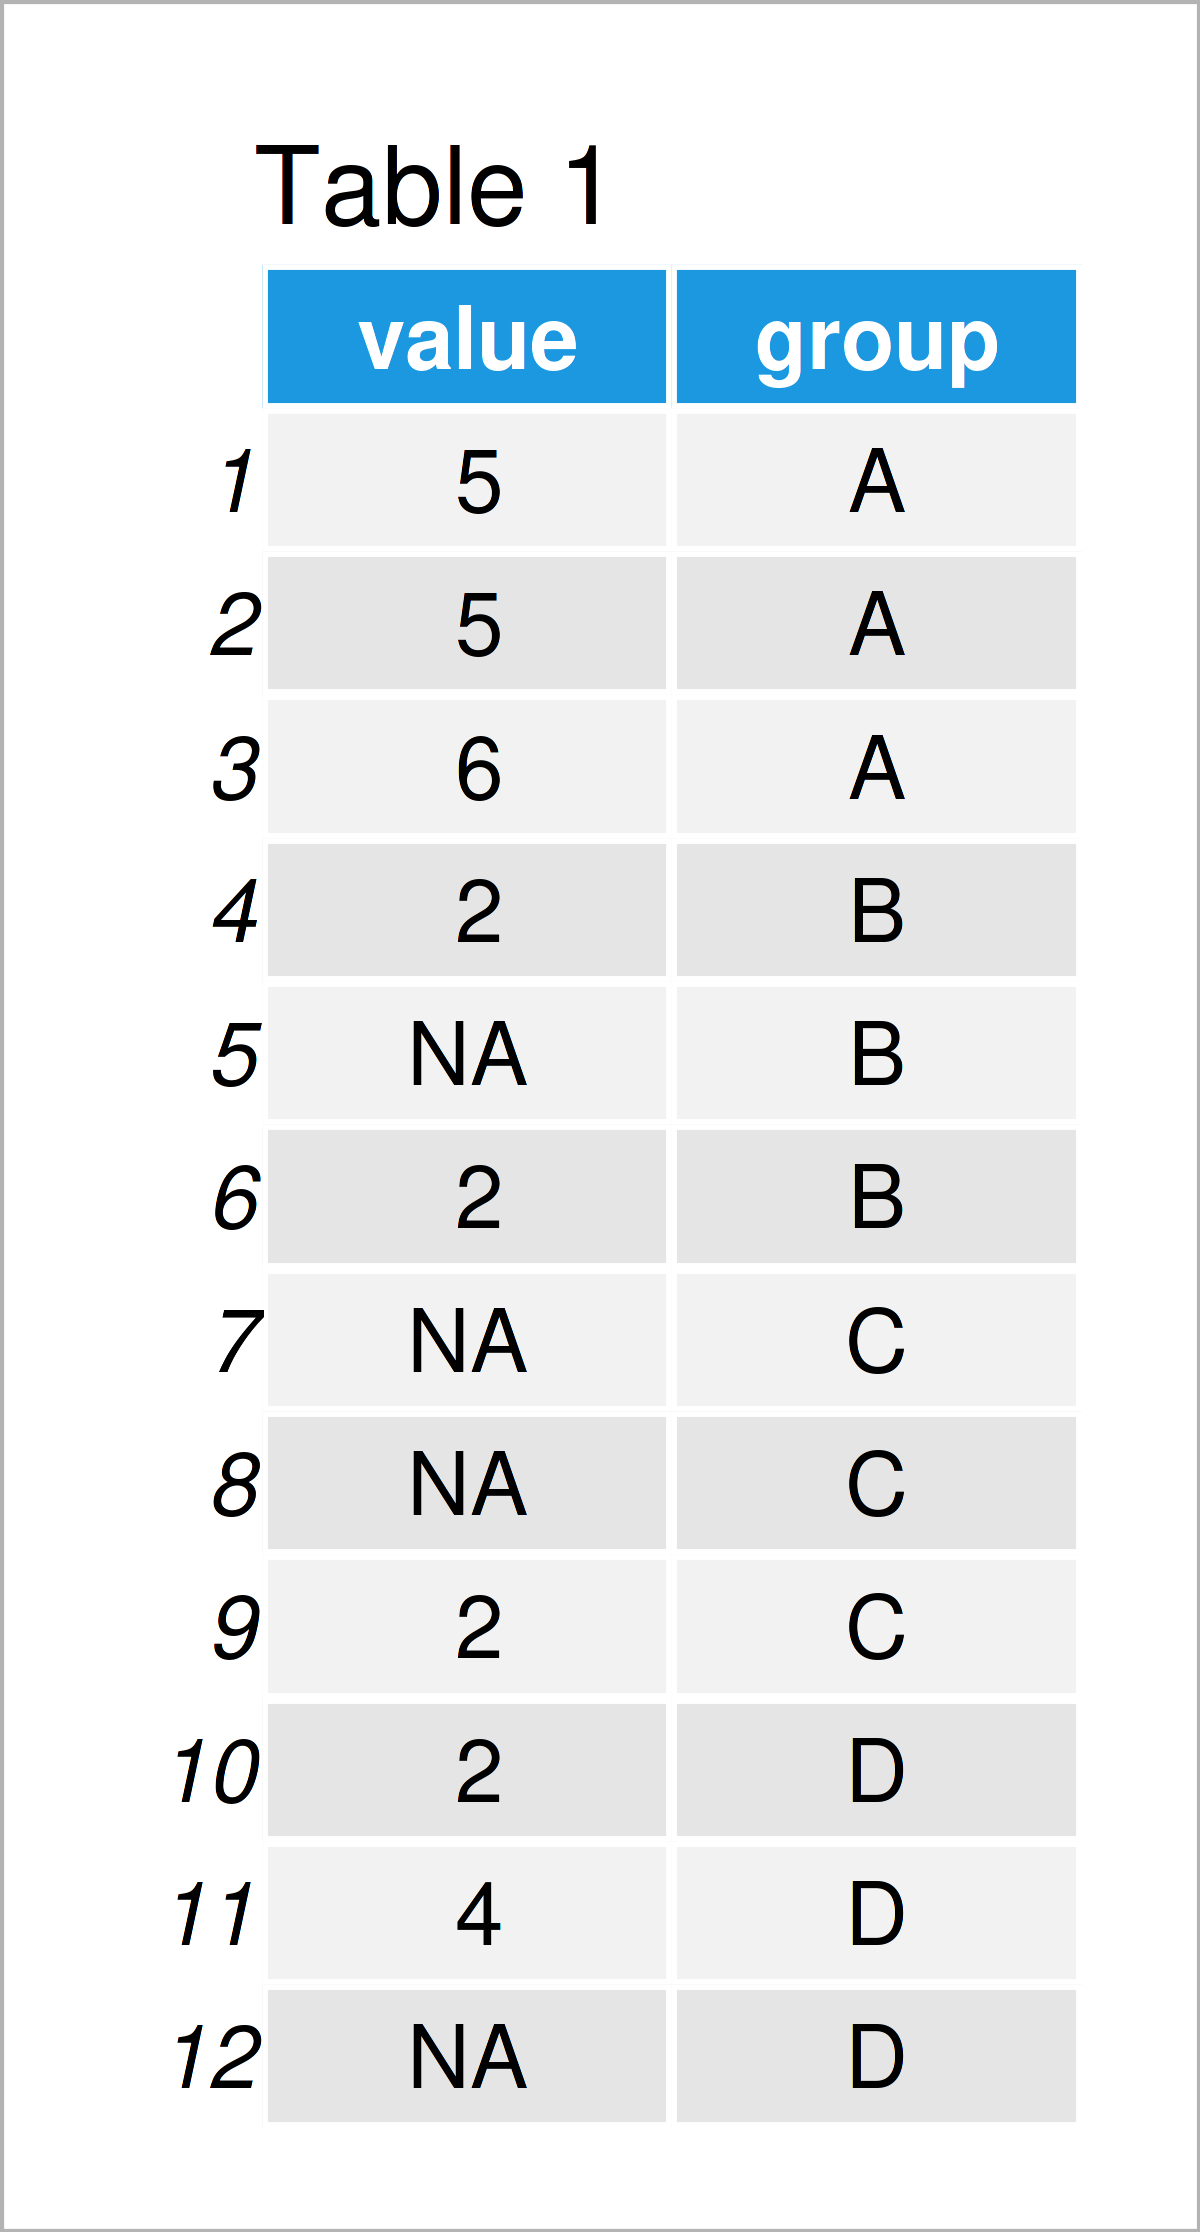
Table 1 visualizes the structure of our example data – It comprises twelve data points and two columns. The variable value has the numeric class and contains several NA values. The column group is a character that will be used as a group indicator.
Example 1: Count Non-NA Values by Group Using aggregate() Function
In this example, I’ll show how to get the number of non-NA values by group using the aggregate function of Base R.
Consider the R syntax below:
non_na_count1 <- aggregate(value ~ group,                   # Count non-NA values by group
                           data,
                           function(x) { sum(!is.na(x)) },
                           na.action = NULL)
non_na_count1                                               # Print non-NA group counts

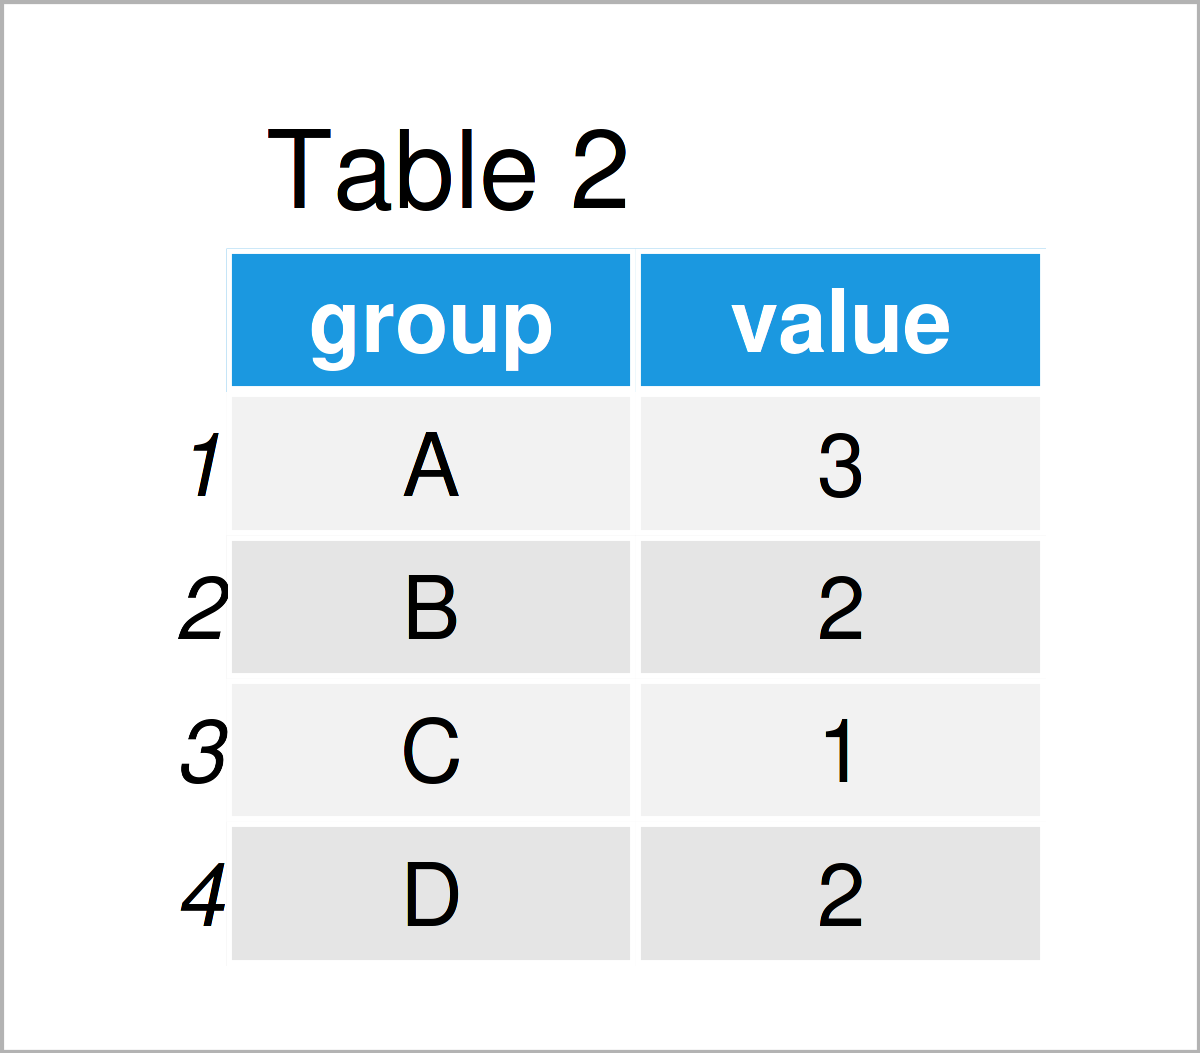
As illustrated in Table 2, we have created a new data frame containing the non-NA counts by group. The group A contains three non-NA values, the group B contains two non-NA values, the group C consist of only one non-NA value, and the group D contains two values that are not missing.
Example 2: Count Non-NA Values by Group Using group_by() & summarize() Functions of dplyr Package
Example 2 illustrates how to apply the functions of the dplyr package to count NA values by group.
We first have to install and load the dplyr package, in order to use the functions that are included in the package:
install.packages("dplyr")                                   # Install & load dplyr
library("dplyr")
In the next step, we can apply the group_by and summarize functions of the dplyr package to count the non-NA values in our data:
non_na_count2 <- data %>%                                   # Count non-NA values by group
  group_by(group) %>%
  dplyr::summarize(non_na = sum(!is.na(value)))
non_na_count2                                               # Print non-NA group counts

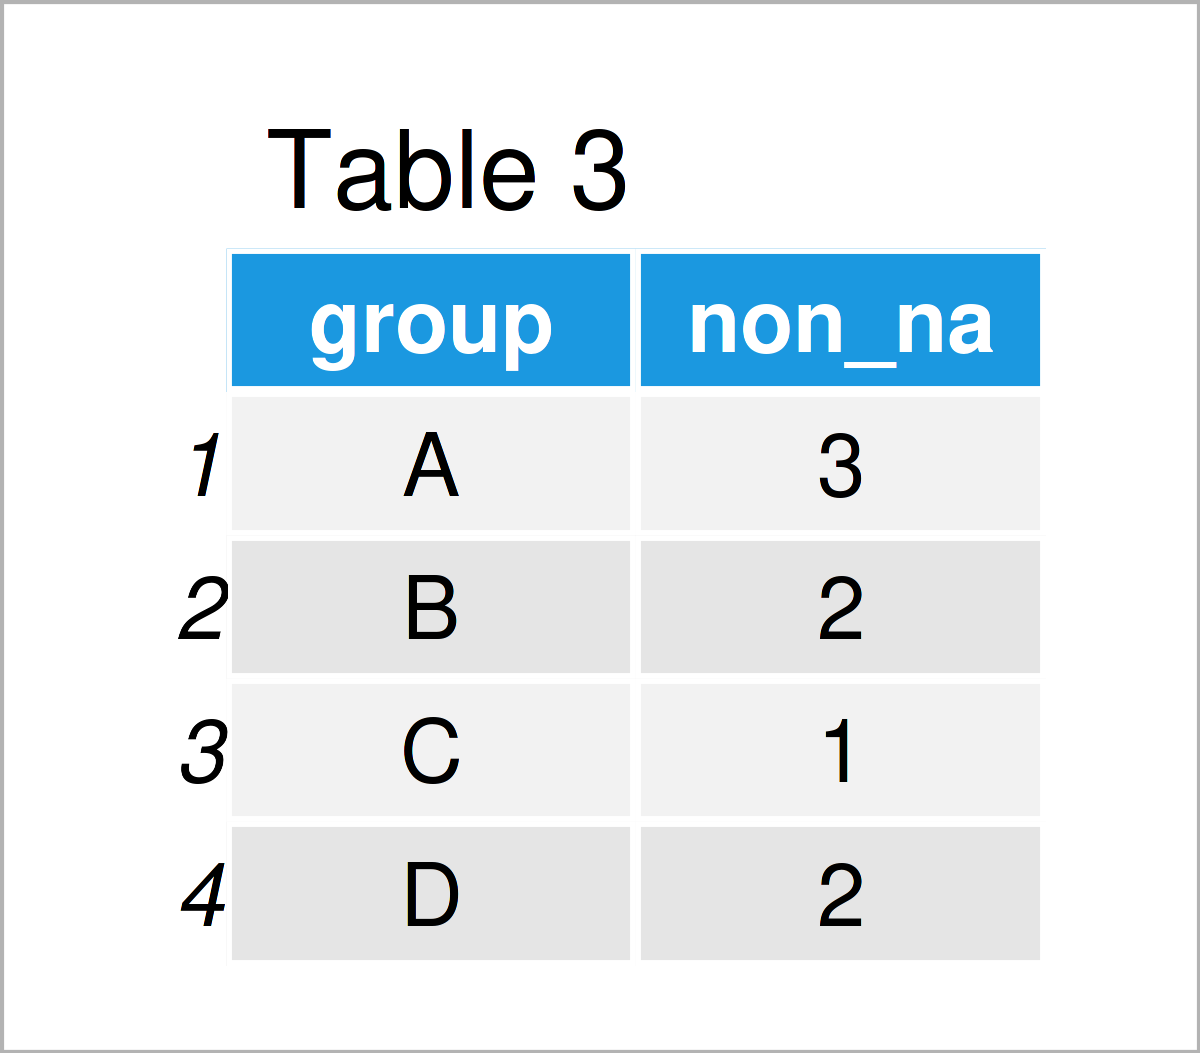
By executing the previous R code, we have created Table 3, i.e. a tibble containing the non-NA counts.
Video & Further Resources
In case you need more explanations on the R codes of this article, I recommend watching the following video on my YouTube channel. I explain the content of this tutorial in the video instruction.
Besides that, you may read the related articles on https://statisticsglobe.com/:
- Count Non-NA Values in R
- Count NA Values by Group in R
- Count Number of Rows by Group Using dplyr Package
- Count Non-Zero Values in Vector & Data Frame Columns
- Count NA Values in R
- Count Unique Values in R
- Count Unique Values by Group in R
- All R Programming Examples
To summarize: This article has demonstrated how to count the number of non-NA values by groups in a data frame in the R programming language. Please let me know in the comments section below, in case you have additional questions.


