Convert GroupBy Object Back to pandas DataFrame in Python (Example)
In this Python tutorial you’ll learn how to display a GroupBy object as a regular pandas DataFrame.
Table of contents:
You’re here for the answer, so let’s get straight to the example!
Exemplifying Data & Libraries
We first need to load the pandas library, to be able to use the corresponding functions:
import pandas as pd # Import pandas library in Python
The following data will be used as a basis for this Python programming tutorial:
data = pd.DataFrame({'x1':[3, 5, 1, 2, 5, 7, 2, 8],     # Create pandas DataFrame
                     'x2':range(1, 9),
                     'group1':['A', 'B', 'A', 'C', 'A', 'C', 'B', 'A'],
                     'group2':['a', 'a', 'a', 'a', 'b', 'b', 'b', 'b']})
print(data)                                             # Print pandas DataFrame

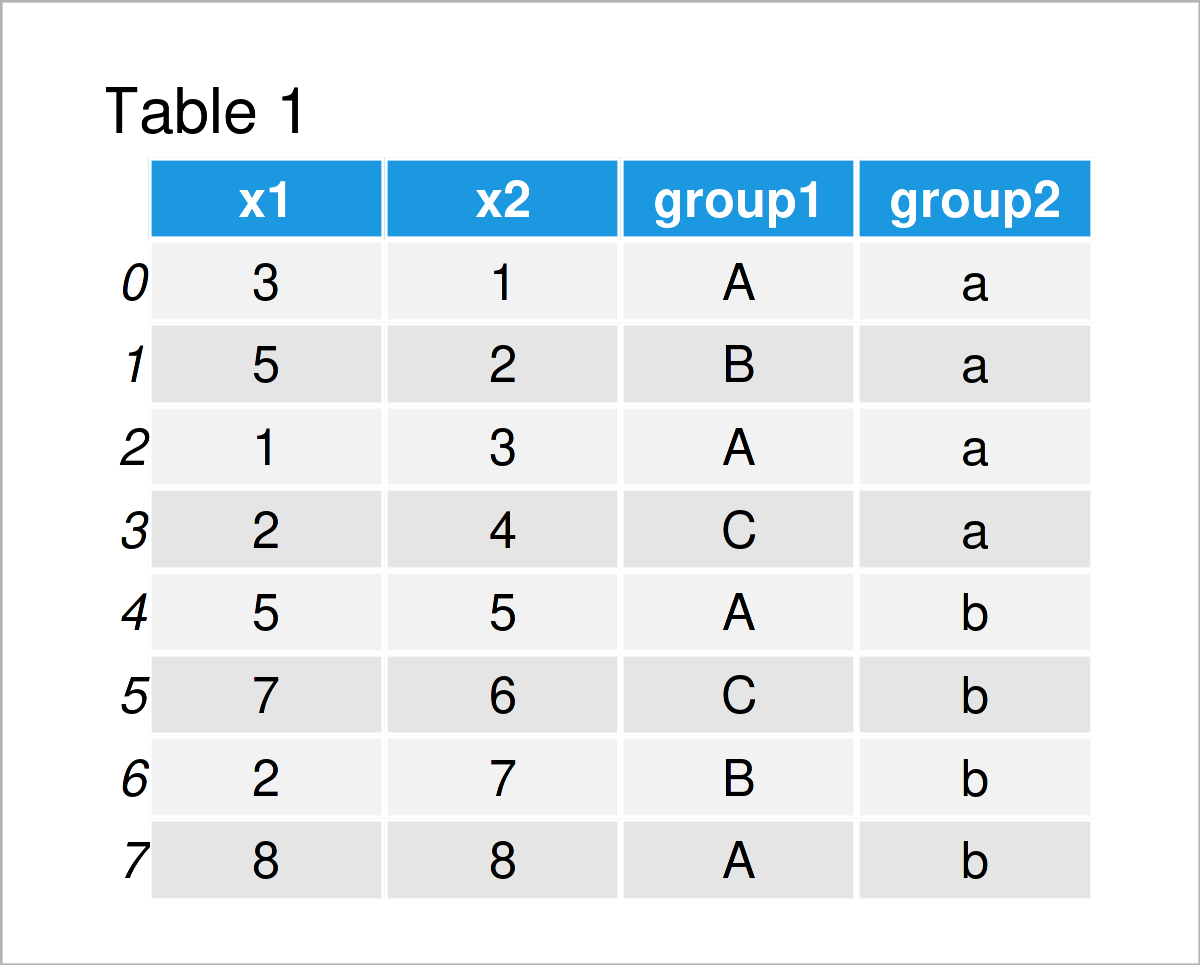
Have a look at the previous table. It illustrates that our example pandas DataFrame contains eight rows and four columns.
Let’s aggregate our data based on the variables group1 and group2.
data_group = data.groupby(['group1', 'group2']).mean()  # Get mean by group
print(data_group)                                       # Print aggregated data
#                 x1   x2
# group1 group2
# A      a       2.0  2.0
#        b       6.5  6.5
# B      a       5.0  2.0
#        b       2.0  7.0
# C      a       2.0  4.0
#        b       7.0  6.0
The previous output of the Python console shows the grouped mean of the variables x1 and x2 based on the two group indicators group1 and group2.
As you can see, the group columns have been set as indices and the group1 index contains each value only once.
Let’s transform this grouped pandas DataFrame back to a new data set with the typical pandas DataFrame structure.
Example: Create Regular pandas DataFrame from GroupBy Object
The Python programming code below illustrates how to construct a regular DataFrame structure after applying the groupby function in Python.
To understand this process, we first have to recognize that our grouped data set actually is a pandas DataFrame (not a series or list or so)!
We can see that by using the type function:
print(type(data_group))                                 # Check class of grouped data
# <class 'pandas.core.frame.DataFrame'>
However, the index structure of our pandas DataFrame is different compared to what we might have expected. The columns group1 and group2 from our input data set have been set as indices after we have applied the groupby function.
We can change this by applying the reset_index function as shown in the following Python code:
data_group_new = data_group.reset_index()               # Reset index of grouped data
print(data_group_new)                                   # Print updated grouped data
#   group1 group2   x1   x2
# 0      A      a  2.0  2.0
# 1      A      b  6.5  6.5
# 2      B      a  5.0  2.0
# 3      B      b  2.0  7.0
# 4      C      a  2.0  4.0
# 5      C      b  7.0  6.0
Have a look at the previous output: It shows that we have converted the two group indicators back to real columns.
Let’s check the data type of our data set once again:
print(type(data_group_new))                             # Check class of updated grouped data
# <class 'pandas.core.frame.DataFrame'>
Our final output is still a pandas.core.frame.DataFrame – looks good!
Video, Further Resources & Summary
Have a look at the following video on my YouTube channel. In the video, I’m showing the Python codes of this article.
Furthermore, you could read the other tutorials on this homepage.
- Handling DataFrames Using the pandas Library in Python
- Group by Two & Multiple Columns of pandas DataFrame
- Count Rows by Group in pandas DataFrame
- Summary Statistics by Group of pandas DataFrame
- Convert pandas DataFrame Column to datetime in Python
- Convert Index to Column of pandas DataFrame in Python
- Convert pandas DataFrame to NumPy Array in Python
- Convert pandas DataFrame Index to List & NumPy Array in Python
- Introduction to Python
In this Python tutorial you have learned how to return a GroupBy object to a regular pandas DataFrame. If you have any further questions, let me know in the comments.


