Count Rows by Group in pandas DataFrame in Python (2 Examples)
In this tutorial, I’ll show how to get the number of cases by group in a pandas DataFrame in the Python programming language.
The tutorial will consist of two examples for the counting of the number of cases by group in a pandas DataFrame. To be more precise, the content of the article is structured as follows:
Let’s dive into it…
Example Data & Add-On Libraries
First, we have to import the pandas library:
import pandas as pd # Import pandas library
Furthermore, consider the following example DataFrame:
data = pd.DataFrame({'x1':[6, 5, 3, 4, 4, 2, 5, 8, 9, 7, 9, 4, 8],  # Create pandas DataFrame
                     'x2':range(9, 22),
                     'group1':['A', 'B', 'A', 'A', 'C', 'C', 'A', 'A', 'A', 'C', 'C', 'B', 'A'],
                     'group2':['a', 'a', 'a', 'a', 'a', 'a', 'a', 'a', 'b', 'b', 'b', 'b', 'b']})
print(data)                                                         # Print pandas DataFrame

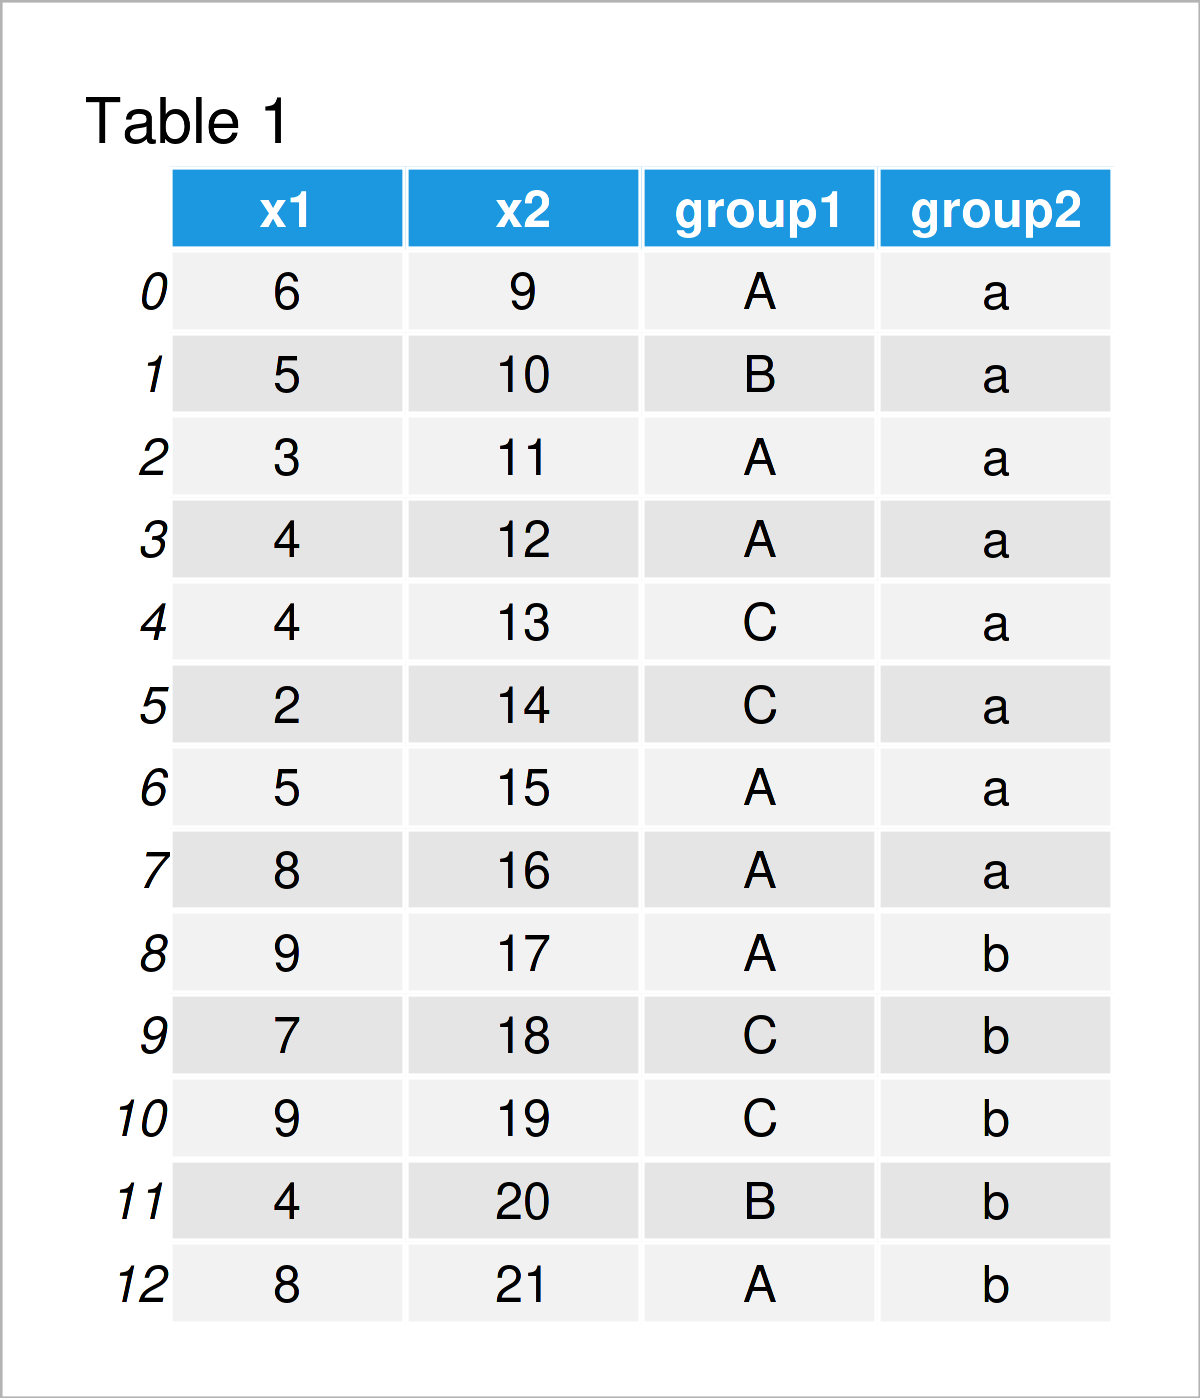
As you can see based on Table 1, our exemplifying data is a DataFrame consisting of 13 rows and four variables. The variables group1 and group2 will be used to group our data set.
Example 1: Count Rows by One Group Column in pandas DataFrame
This example shows how to count the number of observations in each group based on one group indicator column.
To achieve this, we can apply the groupby and size functions as shown below:
print(data.groupby('group1').size())                                # Count rows by one group variable
# group1
# A    7
# B    2
# C    4
# dtype: int64
The previous output shows the number of rows in each group, i.e. the group A contains seven rows, the group B only two rows, and the group C of four rows.
Example 2: Count Rows by Multiple Group Columns in pandas DataFrame
This example illustrates how to use multiple group indicators to split our data in groups and subgroups.
For this task, we can specify a list of group column names within the groupby function as shown in the following Python code:
print(data.groupby(['group1','group2']).size())                     # Count rows by multiple groups
# group1  group2
# A       a         5
#         b         2
# B       a         1
#         b         1
# C       a         2
#         b         2
# dtype: int64
Video, Further Resources & Summary
Would you like to know more about the counting of the number of cases by group in a pandas DataFrame? Then I recommend watching the following video on my YouTube channel. In the video, I’m explaining the examples of this tutorial:
In addition, you may read the related tutorials on my homepage.
- Drop First & Last N Rows from pandas DataFrame in Python
- Count Unique Values in Column of pandas DataFrame in Python
- Mean of Columns & Rows of pandas DataFrame in Python
- Append Rows to pandas DataFrame in Loop in Python
- Sum of Columns & Rows of pandas DataFrame in Python
- Handling DataFrames Using the pandas Library in Python
- Python Programming Overview
To summarize: You have learned in this article how to find the rows by group in a pandas DataFrame in Python. If you have additional questions, don’t hesitate to let me know in the comments section below.


