Contingency Table Across Multiple Columns in R (Example)
In this R tutorial you’ll learn how to make a frequency table for multiple columns.
Table of contents:
Let’s jump right to the R code.
Creating Example Data
To start with, let’s create some example data:
set.seed(34854467)                      # Create example data
data <- data.frame(x1 = rbinom(9, 1, 0.5),
                   x2 = rbinom(9, 1, 0.5),
                   x3 = rbinom(9, 1, 0.5),
                   group = letters[1:3])
data                                    # Print example data

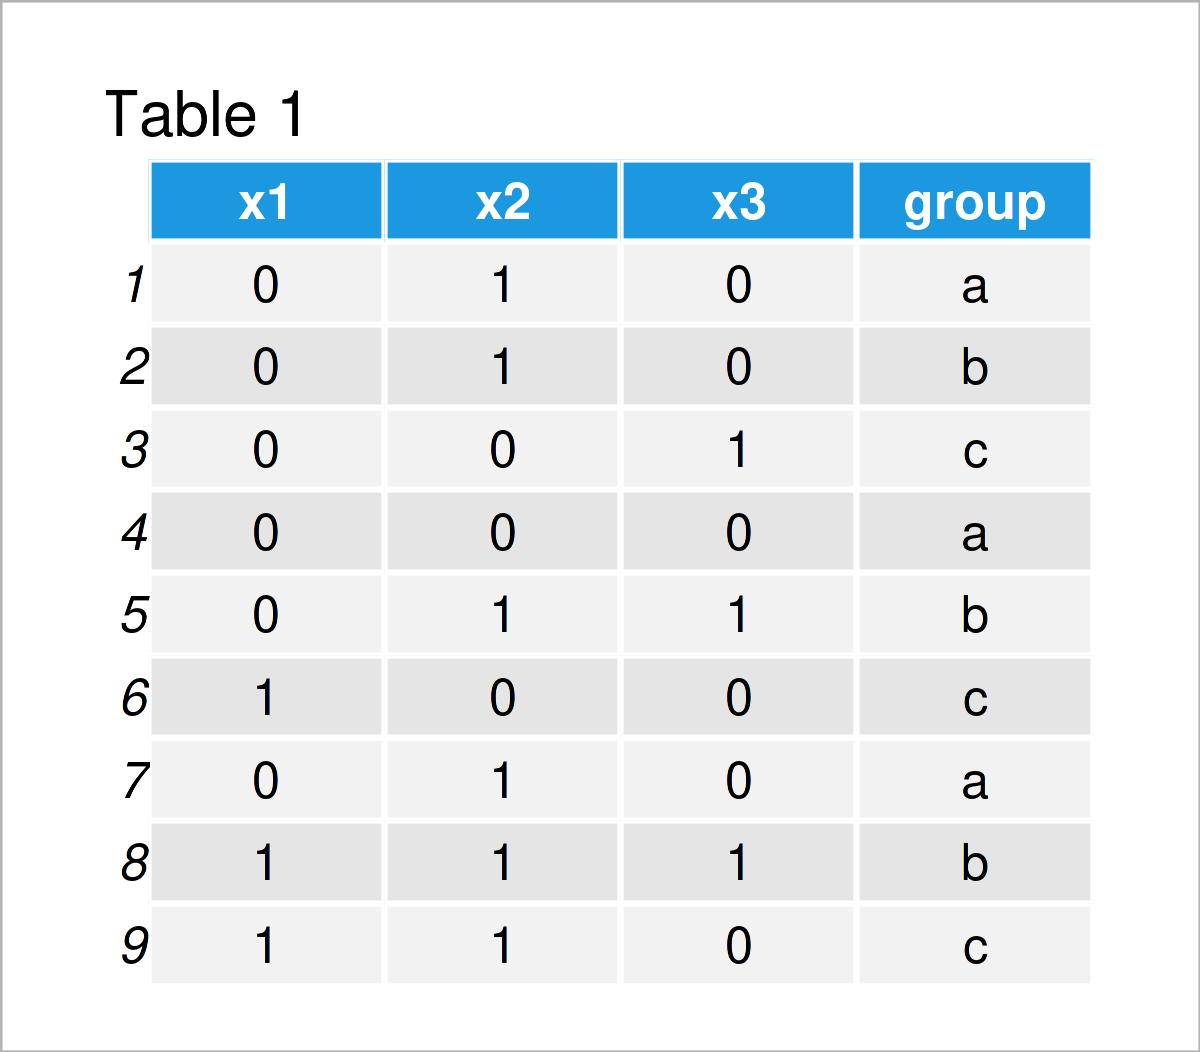
Table 1 shows the structure of our example data – It has nine rows and four columns.
Example: Create Contingency Table Across Multiple Columns
This example illustrates how to create a table with counts using multiple data frame variables.
For this task, we can use the t(), sapply(), tapply(), and sum() functions as shown below:
data_count <- t(sapply(data[ , 1:3],    # Create contingency table
                       function(x) tapply(x, data[ , 4], sum)))
data_count                              # Print contingency table

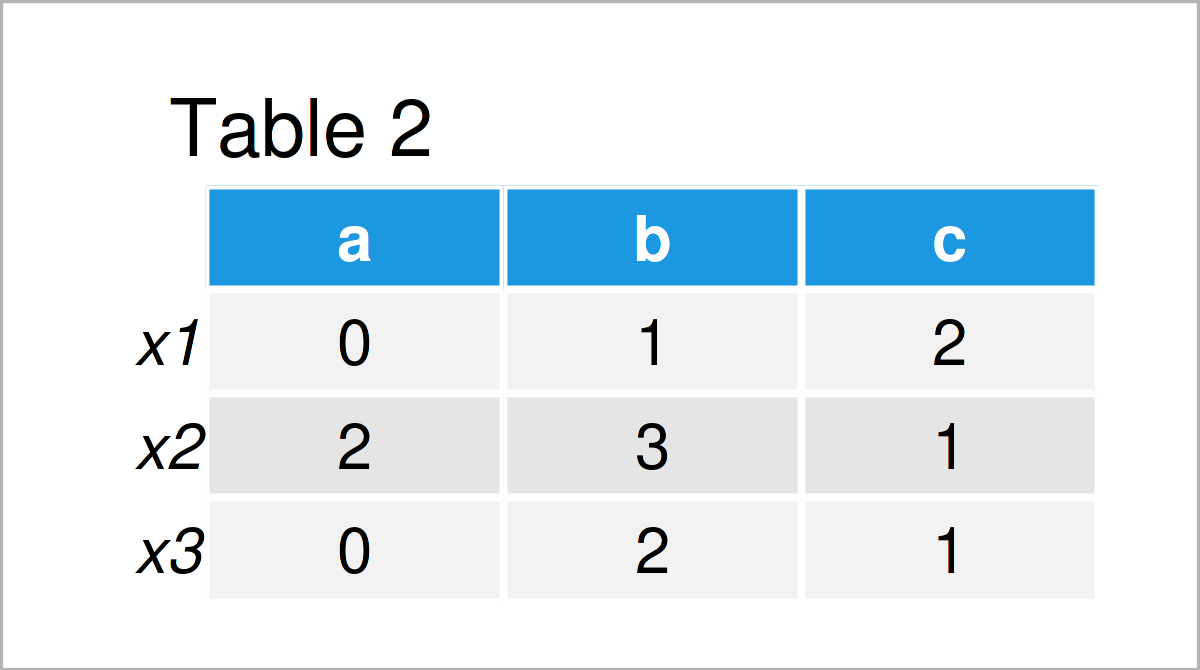
As shown in Table 2, we have created a table with contingencies across several variables with the previous syntax.
Video, Further Resources & Summary
Have a look at the following video on my YouTube channel. I’m explaining the R programming code of this article in the video:
In addition, you may have a look at the other articles on my homepage:
- Split Data Frame Variable into Multiple Columns
- Summarize Multiple Columns of data.table by Group
- Remove Multiple Columns from data.table
- Paste Multiple Columns Together in R
- Sum Across Multiple Rows & Columns Using dplyr Package
- R Programming Examples
In this tutorial you have learned how to make a frequency table for multiple variables in R. Don’t hesitate to let me know in the comments section, in case you have additional questions. Furthermore, please subscribe to my email newsletter to receive updates on the newest tutorials.


10 Comments. Leave new
Hi, nice tutorial.
I have a dataset as this:
millions of rows, and four columns (A,B,C,D).
I want to make contingency tables (2×2) as A[1,1],B[1,2],C,[2,1] and D[2,2]. Later I need to apply a chi-square for each of these contingency tables. I have tried different methods but the p-values vary a lot.
This is an example but it gave me a weird p-value
apply(df[,c(“A” , “B” , “C” , “D”)],
1, function(x) chisq.test(x)[c(‘statistic’, ‘p.value’)] ), p-value for each row (or table2x2) is different than chisq.test(x), where x:
x <- matrix(c(2,2,2,6), byrow = TRUE, 2, 2), these are the four values for the matrix
any help would be highly appreciated.
Thanks
Hello,
I am afraid I didn’t understand what you would like to implement. So you would like to calculate chi-square for the pairs of A&B, A&C, A&D, B&C, B&D, and C&D. This makes 6 values, but you expect 4. Could you please clarify this?
Regards,
Cansu
Hi Cansu,
Thanks for answering and sorry for not being clear.
I need a chi-square with data from each row: A,B,C,D. Being the matrix in this form:A[1,1],B[1,2],C,[2,1] and D[2,2].
In other words I´d like to do the following for all the rows in my dataframe.
x <- matrix(c(2,2,2,6), byrow = TRUE, 2, 2), these are the four values for the matrix
chisq.test(x)
I hope this is much clear. Thanks
Hello,
The chi-square test is computed to calculate the association between two-factor variables. So basically, you need 2 columns to select, each for the one-factor variable. Then chisq.test(data$col1, datacol2) or chisq.test(table(data$col1, datacol2))should give you the result. See this page and this page for a detailed explanation. If you still struggle, please share your data, at least the first few rows, here. Then I can understand where you have the problem.
Regards,
Cansu
Thanks. Those pages were helpful but didn’t answer my question. This is what my actual data look like:
AC_TOP <- c(2,2,2,6,18)
AC_Bottom <-c(2,2,4,28,3)
AN_Top<- c(2,20,4,4,14)
AN_Bottom <-c(6,10,4,2,19)
total 1 million rows. I need to obtain chi. square for each row. In other words, make 2×2 table for each row to obtain a chi-square for each one. I tried making a matrix and looping each one but it didn’t work.
Hello,
I am sorry for asking again, but what are AC_TOP, etc.? Are they your columns/variables? Also, I don’t get very well what you mean by calculating the chi-square for each row or making a contingency table for each row. Could you please elaborate on it?
Regards,
Cansu
These are names of columns, counts of plants for an specific variant.so the 4 columns represent measures of 4 plants variants in different regions.
I want to to this for the each row:
data <- matrix(c(2,2,2,6)), chisq.test(data),being 2,2,2,6 numbers in the same row of the data shown.
Instead of doing chisq.test(x) for each row manually, I’d like to do it for each row in a single step.
Hello,
Thank you, now it is more clear. See the following:
You see that you receive an error saying that your chi-square calculation might not be correct. This is due to the fact that you have very low counts (rule of thumb lower than 5). In such cases, the results may not be robust. Therefore, trying more robust association tests like Fisher could be a good idea.
Regards,
Cansu
Hi, Cansu
Thanks very much for this. I ended up using Fisher test.
Thanks
Alan
Welcome!
Regards,
Cansu