Common Main Title for Multiple Plots in Base R & ggplot2 (2 Examples)
In this tutorial, I’ll explain how to draw a grid of plots with a shared main title in the R programming language.
Table of contents:
Let’s dig in.
Example Data & Default Graphic
Let’s first construct some example data:
data <- data.frame(x1 = 8:3,                  # Create example data
                   x2 = 2:7)
data                                          # Print example data

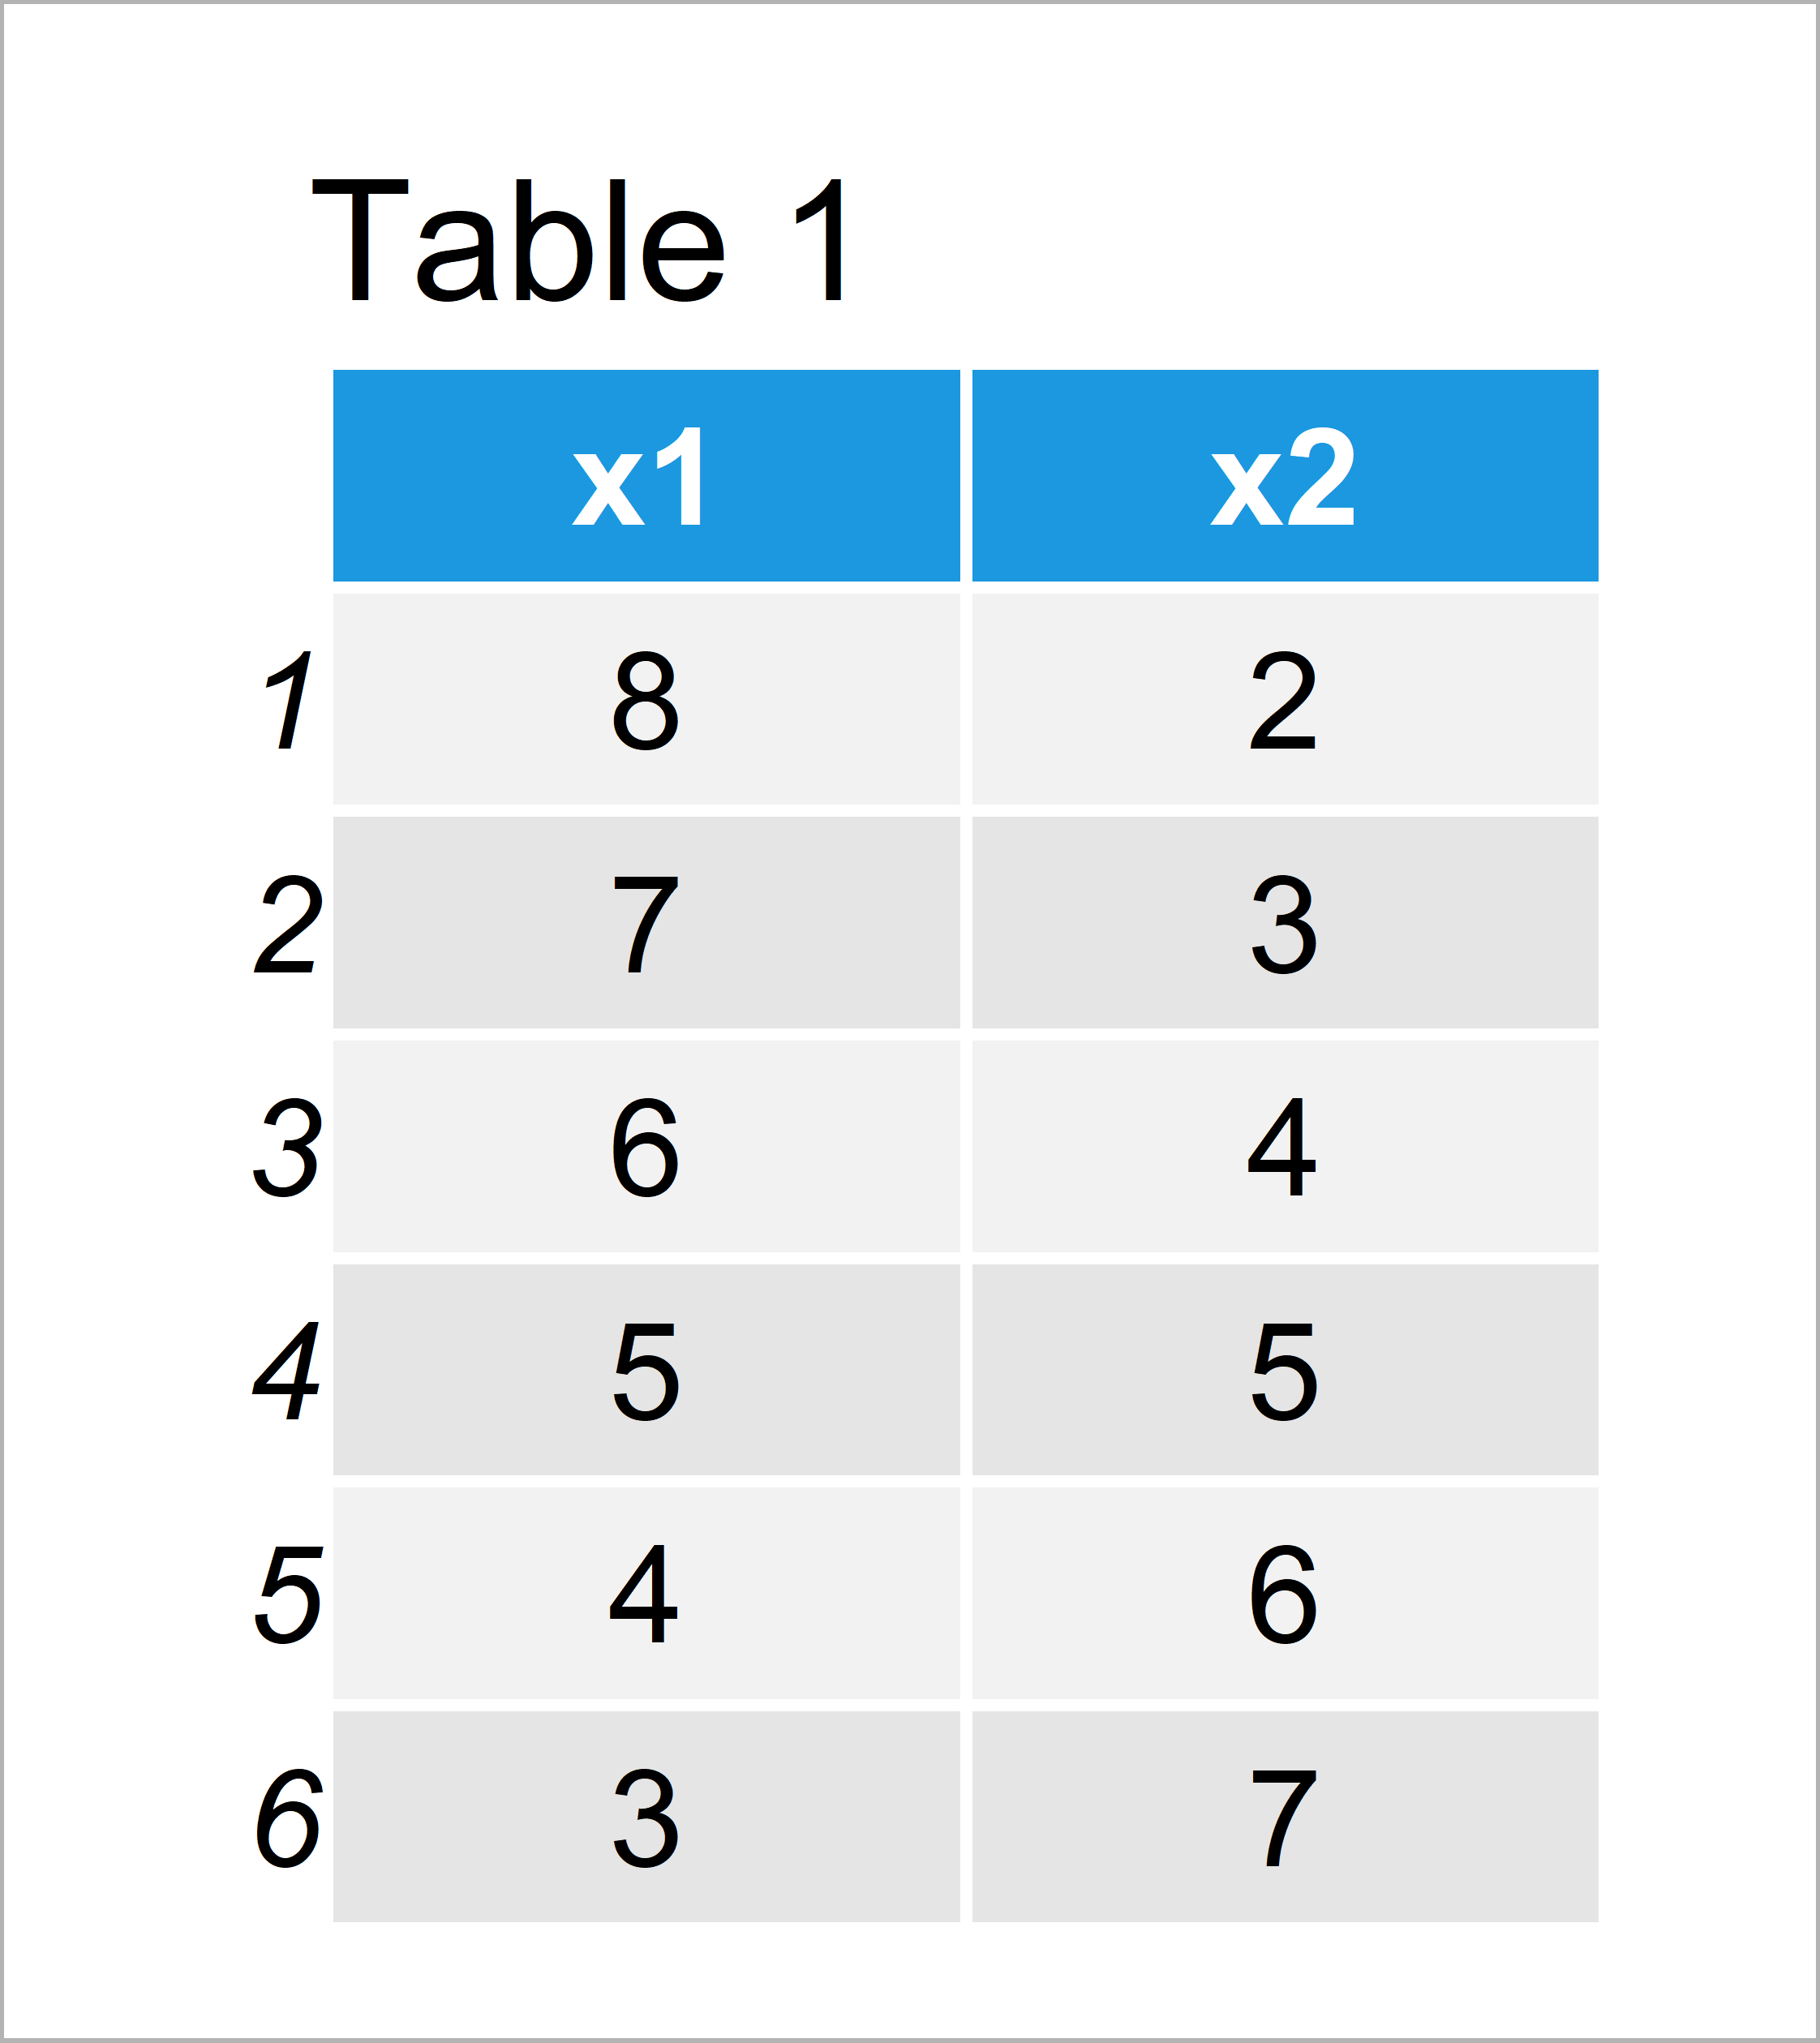
Table 1 shows the structure of our example data – It is constructed of six rows and two variables.
Example 1: Common Main Title for Multiple Plots Using Base R
In Example 1, I’ll show how to draw a multi-plot grid with shared main title using the basic features of the R programming language.
For this task, we have to apply the par function in combination with the mfrow argument as well as the mtext function to add our title:
par(mfrow = c(2, 2))                          # Specify grid of plots
plot(data$x1, data$x2)                        # Draw plots
plot(density(data$x1), main = "")
hist(data$x1, main = "")
barplot(data$x1)
mtext("My Multiplot Title",                   # Add main title
      side = 3,
      line = - 2,
      outer = TRUE)

The output of the previous syntax is shown in Figure 1: A Base R graphic consisting of several plots and a common main title.
Example 2: Common Main Title for Multiple Plots Using ggplot2 & patchwork Packages
Example 2 explains how to add a shared main title to a grid of ggplot2 plots.
First, we need to install and load the ggplot2 package:
install.packages("ggplot2")                   # Install & load ggplot2 package
library("ggplot2")
Next, we can create several different plot objects as shown below:
ggp1 <- ggplot(data, aes(x1, x2)) +           # Create ggplot2 plots
  geom_point()
ggp2 <- ggplot(data, aes(x1)) +
  geom_density()
ggp3 <- ggplot(data, aes(x1)) +
  geom_histogram()
ggp4 <- ggplot(data, aes(x1, x2)) +
  geom_bar(stat = "identity")
To create our grid of plots, we can use the patchwork package. First, we have to install and load the patchwork package:
install.packages("patchwork")                 # Install & load patchwork package
library("patchwork")
Now, we can use the syntax and functions provided by the patchwork package to draw multiple ggplot2 graphs with a common legend as shown below:
ggp_all <- (ggp1 + ggp2) / (ggp3 + ggp4) +    # Create grid of plots with title
  plot_annotation(title = "My Multiplot Title") &
  theme(plot.title = element_text(hjust = 0.5))
ggp_all                                       # Draw grid of plots with title

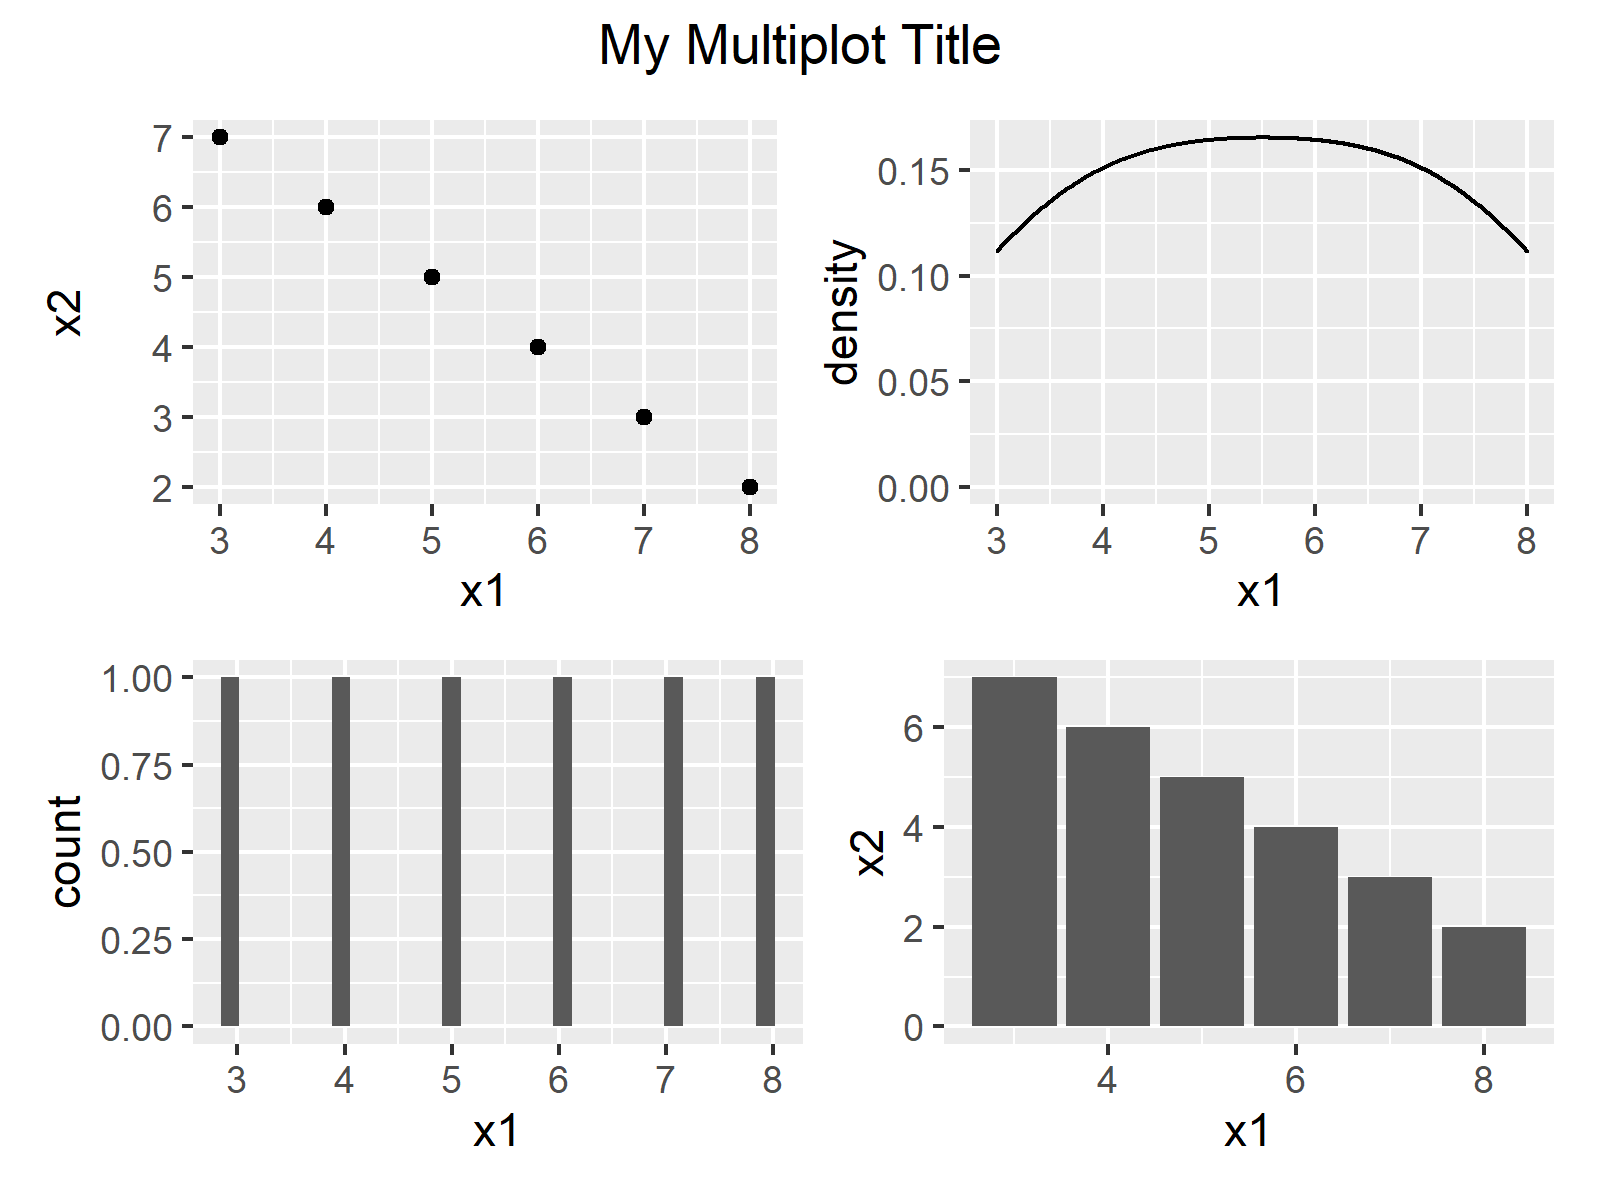
As shown in Figure 2, we have managed to create a grid layout of multiple ggplot2 graphics and a common legend by running the previous syntax.
Video & Further Resources
Do you need further information on the examples of this article? Then you might have a look at the following video tutorial that I have published on my YouTube channel. In the video, I explain the R codes of this article.
Furthermore, you might read the other articles on Statistics Globe. I have published numerous related tutorials on topics such as graphics in R, ggplot2, and data inspection:
- Change Font Size of ggplot2 Plot in R
- Add Common Legend to Combined ggplot2 Plots
- Draw Multiple ggplot2 Plots Side-by-Side (R Example)
- Plotting Data in R
- All R Programming Tutorials
In summary: At this point you should have learned how to create a graphic composition containing multiple combined plots and a common title in the R programming language.
Note that I have shown only one possible solution for adding a shared main title to a grid of plots. However, there are other alternatives available.
For instance, in case of Base R it would also be possible to use the layout function. In case of the ggplot2 environment it would be possible to use the gridExtra package instead of the patchwork package to place a shared main title above a multi-plot panel.
In case you have additional questions, let me know in the comments section. Besides that, don’t forget to subscribe to my email newsletter to get updates on new articles.


4 Comments. Leave new
Very helpful – many thanks. I want two main tiltles – for example, one title for (ggp1 + ggp2) and another title for (ggp3 + ggp4). And finally combine 4 plots into one. Do you have any suggestion?
Hello Zahid,
Please try the following solution.
It is supposed to print the following visual.
Best,
Cansu
Very helpful – many thanks. I think similar work can be done with patchwork and grid as well
data <- data.frame(x1 = 8:3, # Create example data
x2 = 2:7)
data # Print example data
library("ggplot2")
library("patchwork")
library("grid")
ggp1 <- ggplot(data, aes(x1, x2)) + # Create ggplot2 plots
geom_point()
ggp2 <- ggplot(data, aes(x1)) +
geom_density()
ggp3 <- ggplot(data, aes(x1)) +
geom_histogram()
ggp4 <- ggplot(data, aes(x1, x2)) +
geom_bar(stat = "identity")
title1 <- grid::textGrob(label = "Main Title 1")
title2 <- grid::textGrob(label = "Main Title 1")
combine_1 = (wrap_elements(panel = title1) / (ggp1 + ggp2)) + plot_layout(heights = c(1, 10))
combine_2 = (wrap_elements(panel = title2) / (ggp3 + ggp4)) + plot_layout(heights = c(1, 10))
(combine_1 / combine_2) + plot_layout(heights = c(1, 10, 11))
Hello Zahid,
Yes, looks great. Thank you for sharing!
Best,
Cansu