Combine Base R, ggplot2 & lattice Plots (2 Examples)
This article shows how to create a grid of Base R, ggplot2, and lattice plots in the R programming language.
The article will contain two examples for the creation of a grid of Base R, ggplot2, and lattice plots. To be more precise, the post looks as follows:
If you want to learn more about these topics, keep reading.
Exemplifying Data, Software Packages & Basic Plot
We’ll use the data below as basement for this tutorial:
data <- data.frame(x = 1:6,                           # Create example data
                   y = c(3, 1, 4, 2, 5, 3))
data                                                  # Print example data
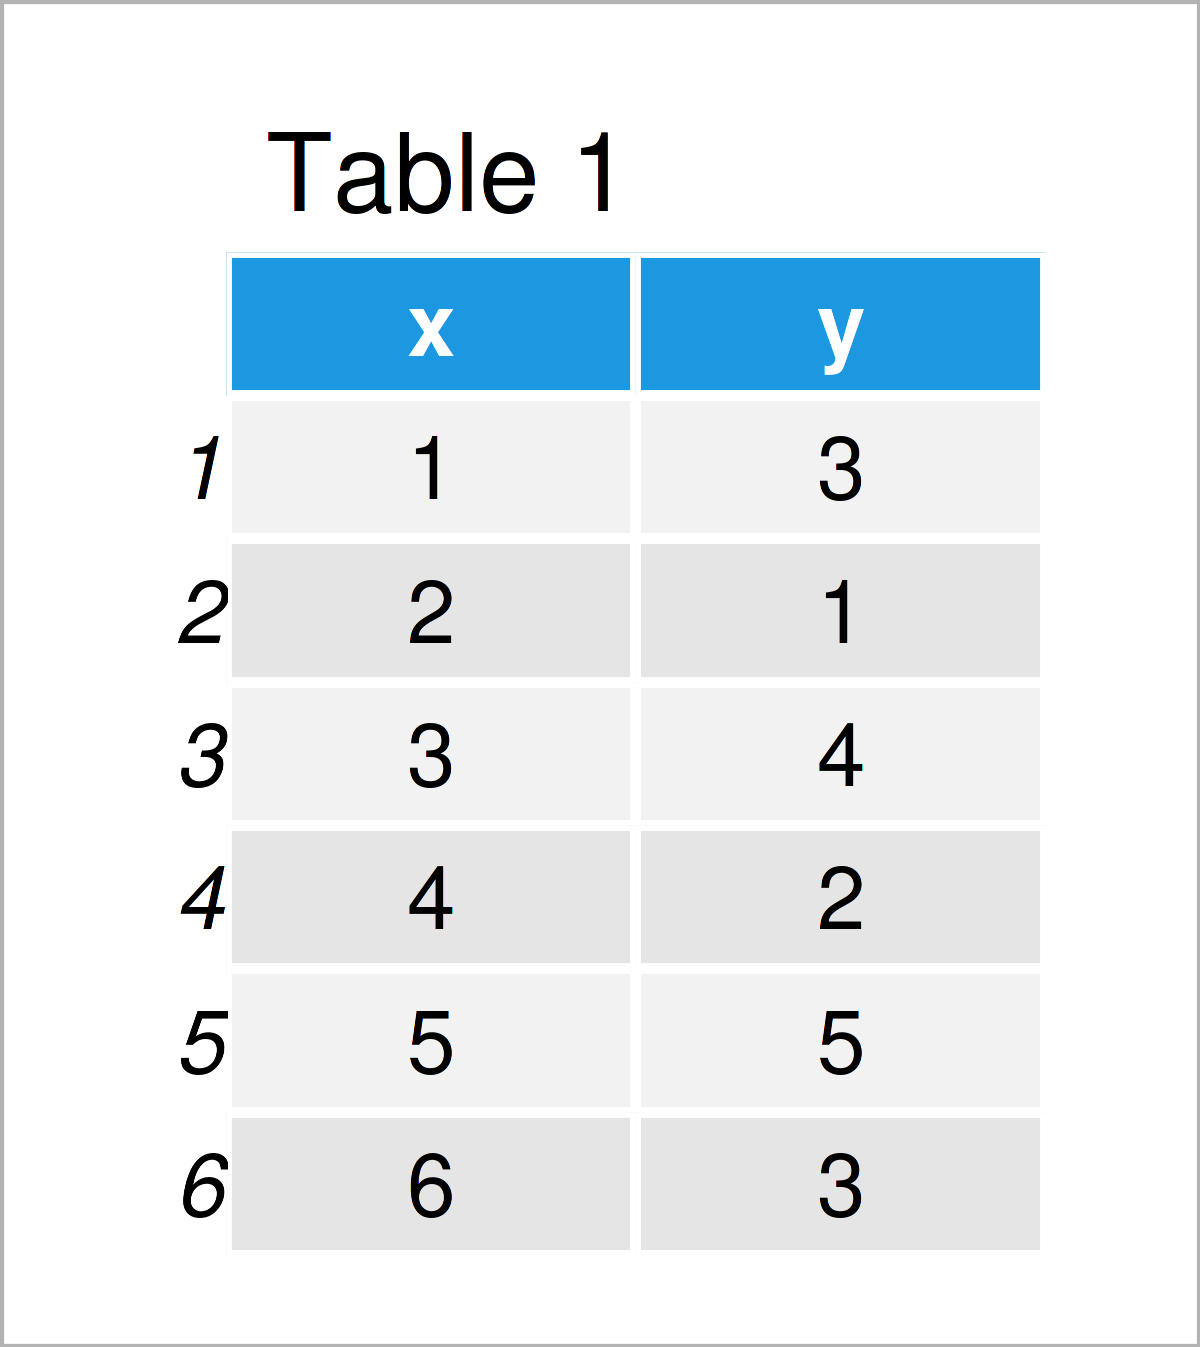
As you can see based on Table 1, our exemplifying data is a data frame containing six observations and the two columns “x” and “y”. The variable x is an integer and the variable y has the numeric class.
Now, we can plot the data using Base R as shown below:
plot(data$x, data$y, type = "l") # Create Base R plot
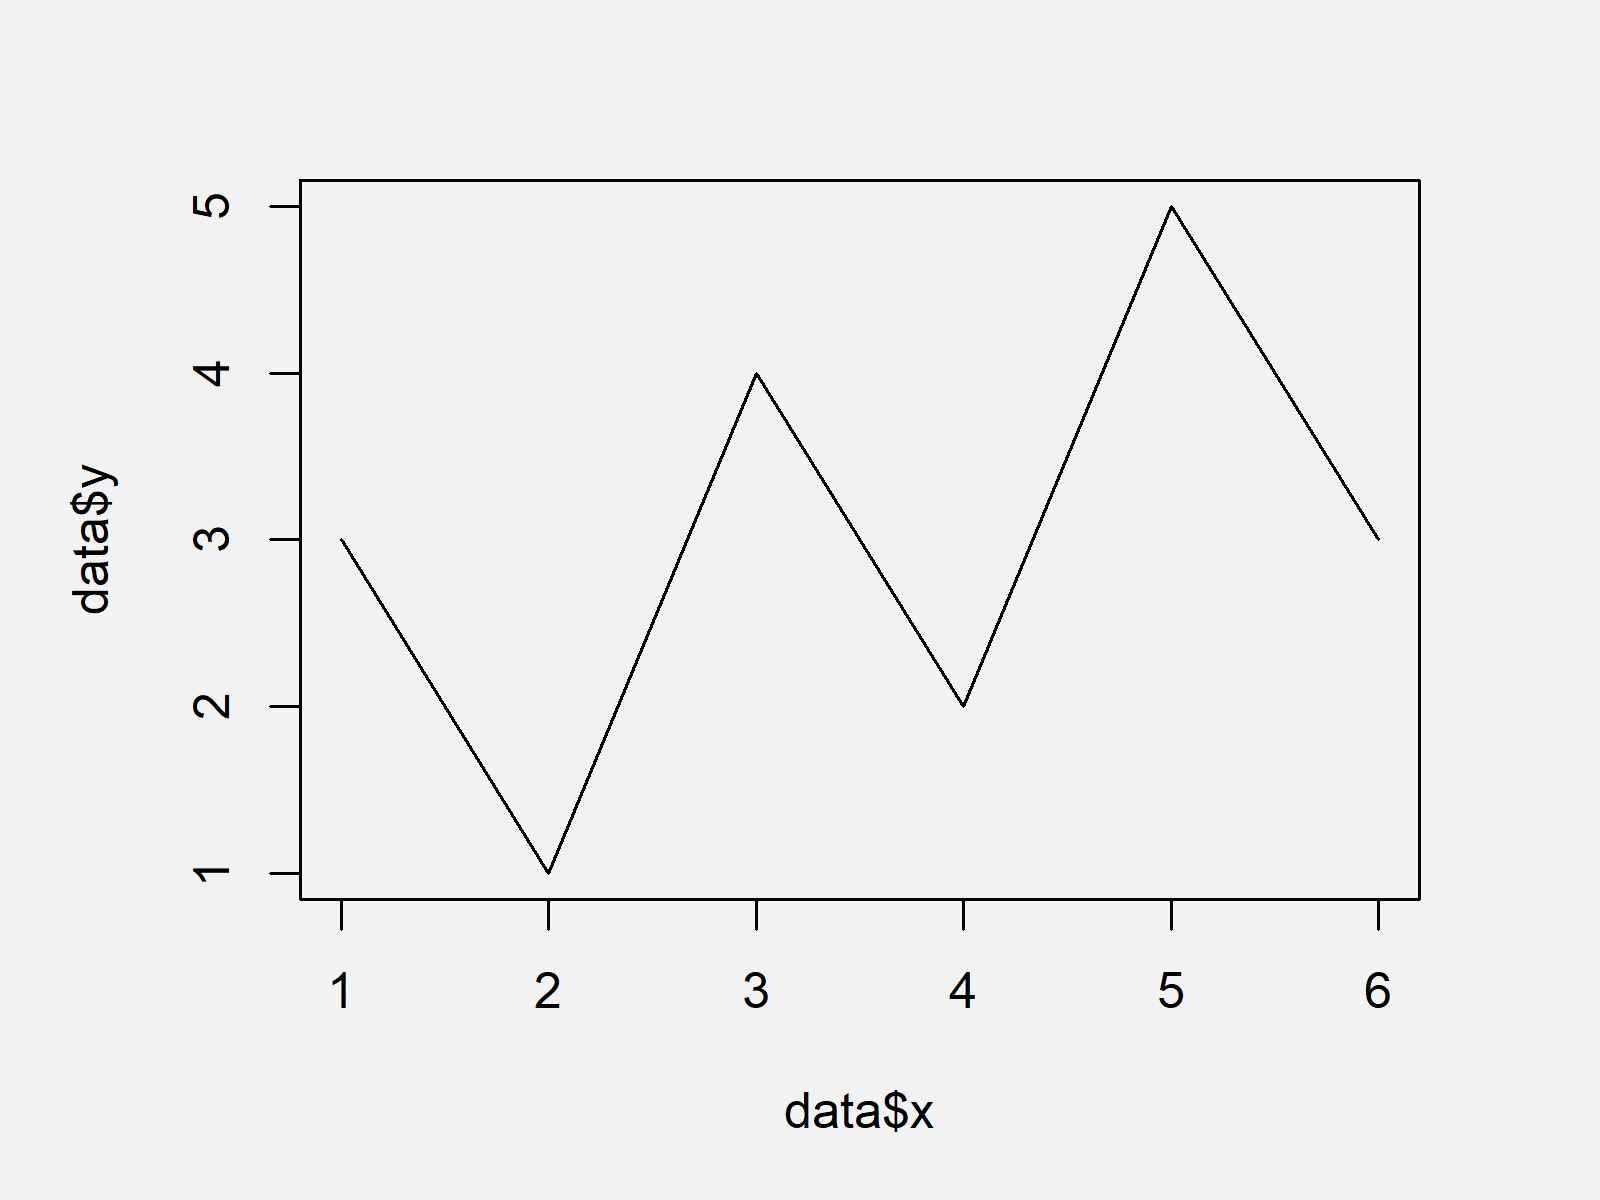
In Figure 1 it is shown that we have created a line plot using the basic installation of the R programming language by running the previous R programming code.
Next, we have to save this plot in a data object using the recordPlot function:
my_base <- recordPlot() # Save Base R plot
Next, we have to create a ggplot2 plot. In order to use the functions of the ggplot2 package, we also need to install and load ggplot2 to RStudio:
install.packages("ggplot2")                           # Install & load ggplot2 package
library("ggplot2")
We can now create a ggplot2 plot object as shown below:
my_ggplot <- ggplot(data, aes(x, y)) +                # Create ggplot2 plot
  geom_line()
my_ggplot                                             # Save ggplot2 plot

The output of the previous code is shown in Figure 2 – A ggplot2 line graph.
To be able to create a lattice plot, we’ll also have to install and load the lattice package to R:
install.packages("lattice")                           # Install & load lattice
library("lattice")
Next, we can create a lattice line plot using the xyplot function as shown in the following R syntax:
my_lattice <- xyplot(y ~ x, data = data, type = "l")  # Create lattice plot
my_lattice                                            # Save lattice plot
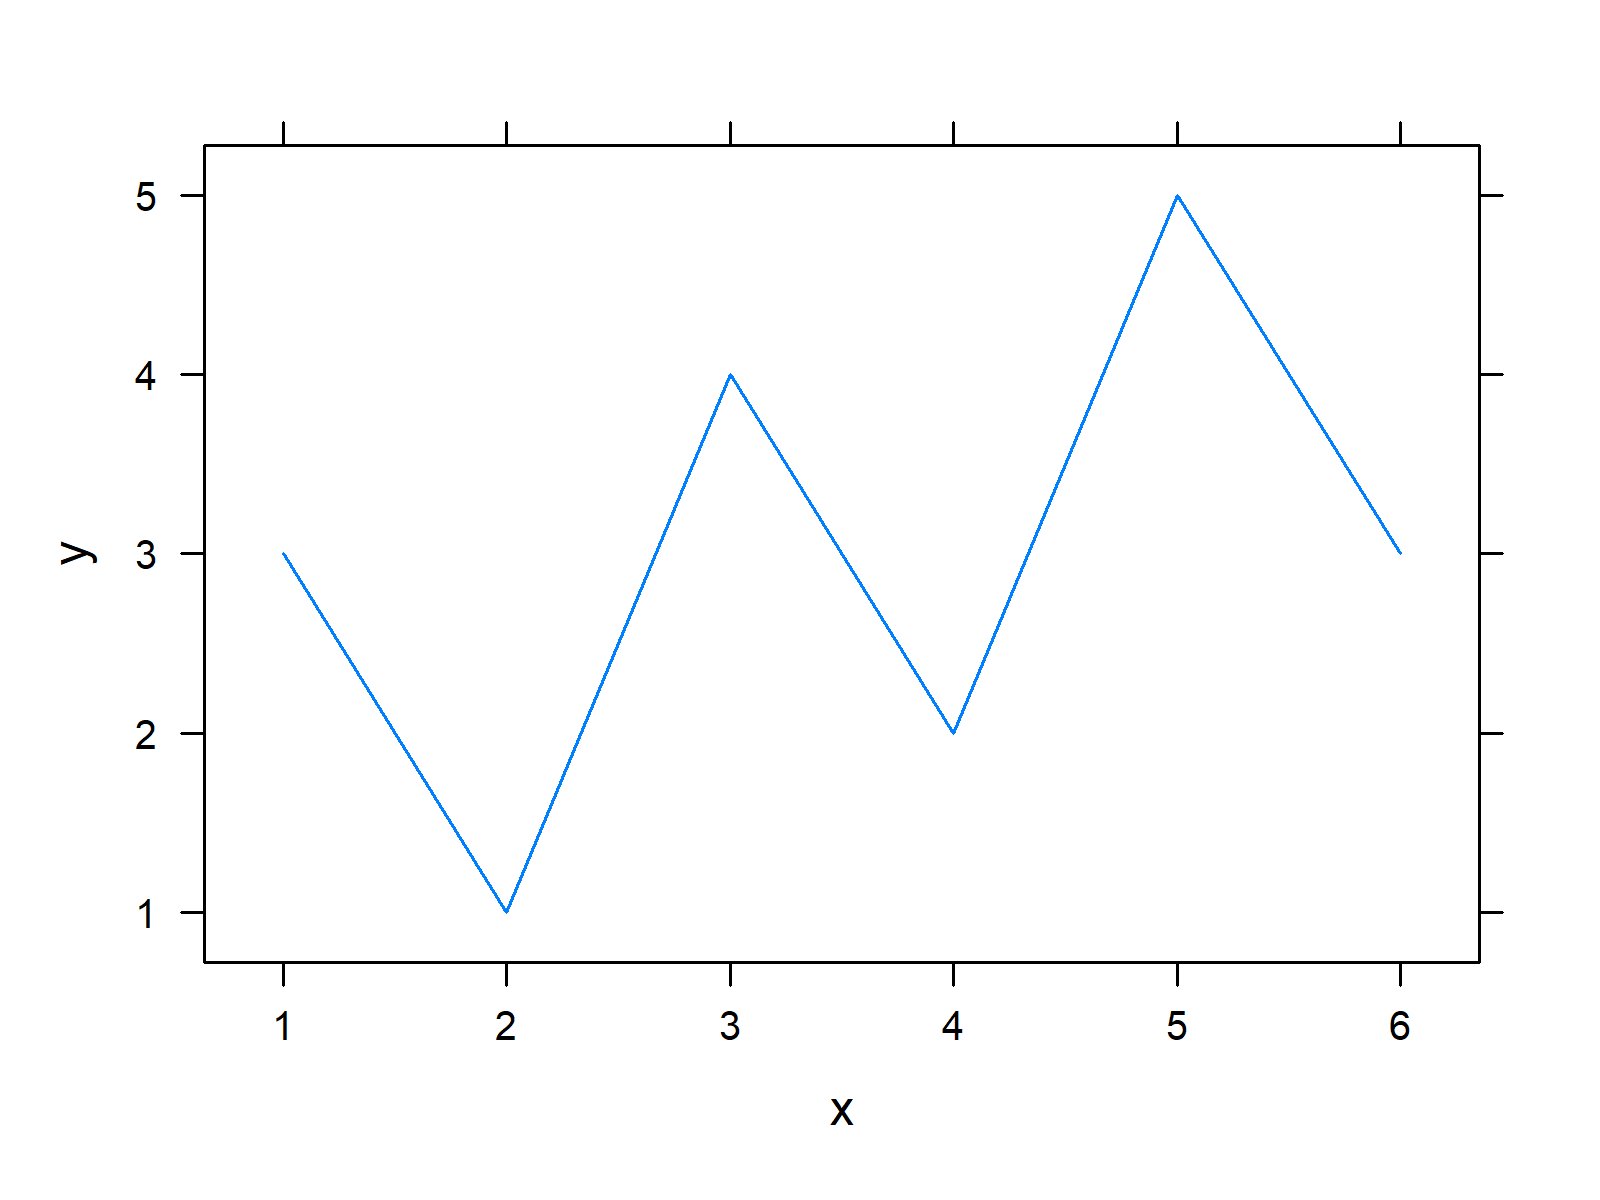
The lattice plot that was drawn by the previous R code is shown in Figure 3.
In the following examples, I’ll explain how to combine our three graphs in a single grid of plots. Keep on reading!
Example 1: Create Grid of Plots Using cowplot Package
In Example 1, I’ll explain how to use the cowplot package to draw a grid of plots containing Base R, ggplot2, and lattice graphics.
If we want to use the functions of the cowplot package, we also have to install and load cowplot:
install.packages("cowplot")                           # Install cowplot package
library("cowplot")                                    # Load cowplot
Finally, we can use the plot_grid function to draw our plots side-by-side. Note that we are using the hjust and labels arguments to add a title to each plot in our grid:
plot_grid(my_base,                                    # Create grid of plots
          my_ggplot,
          my_lattice,
          ncol = 3,
          hjust = - 1.5,
          labels = c("Base R", "ggplot2", "lattice"))
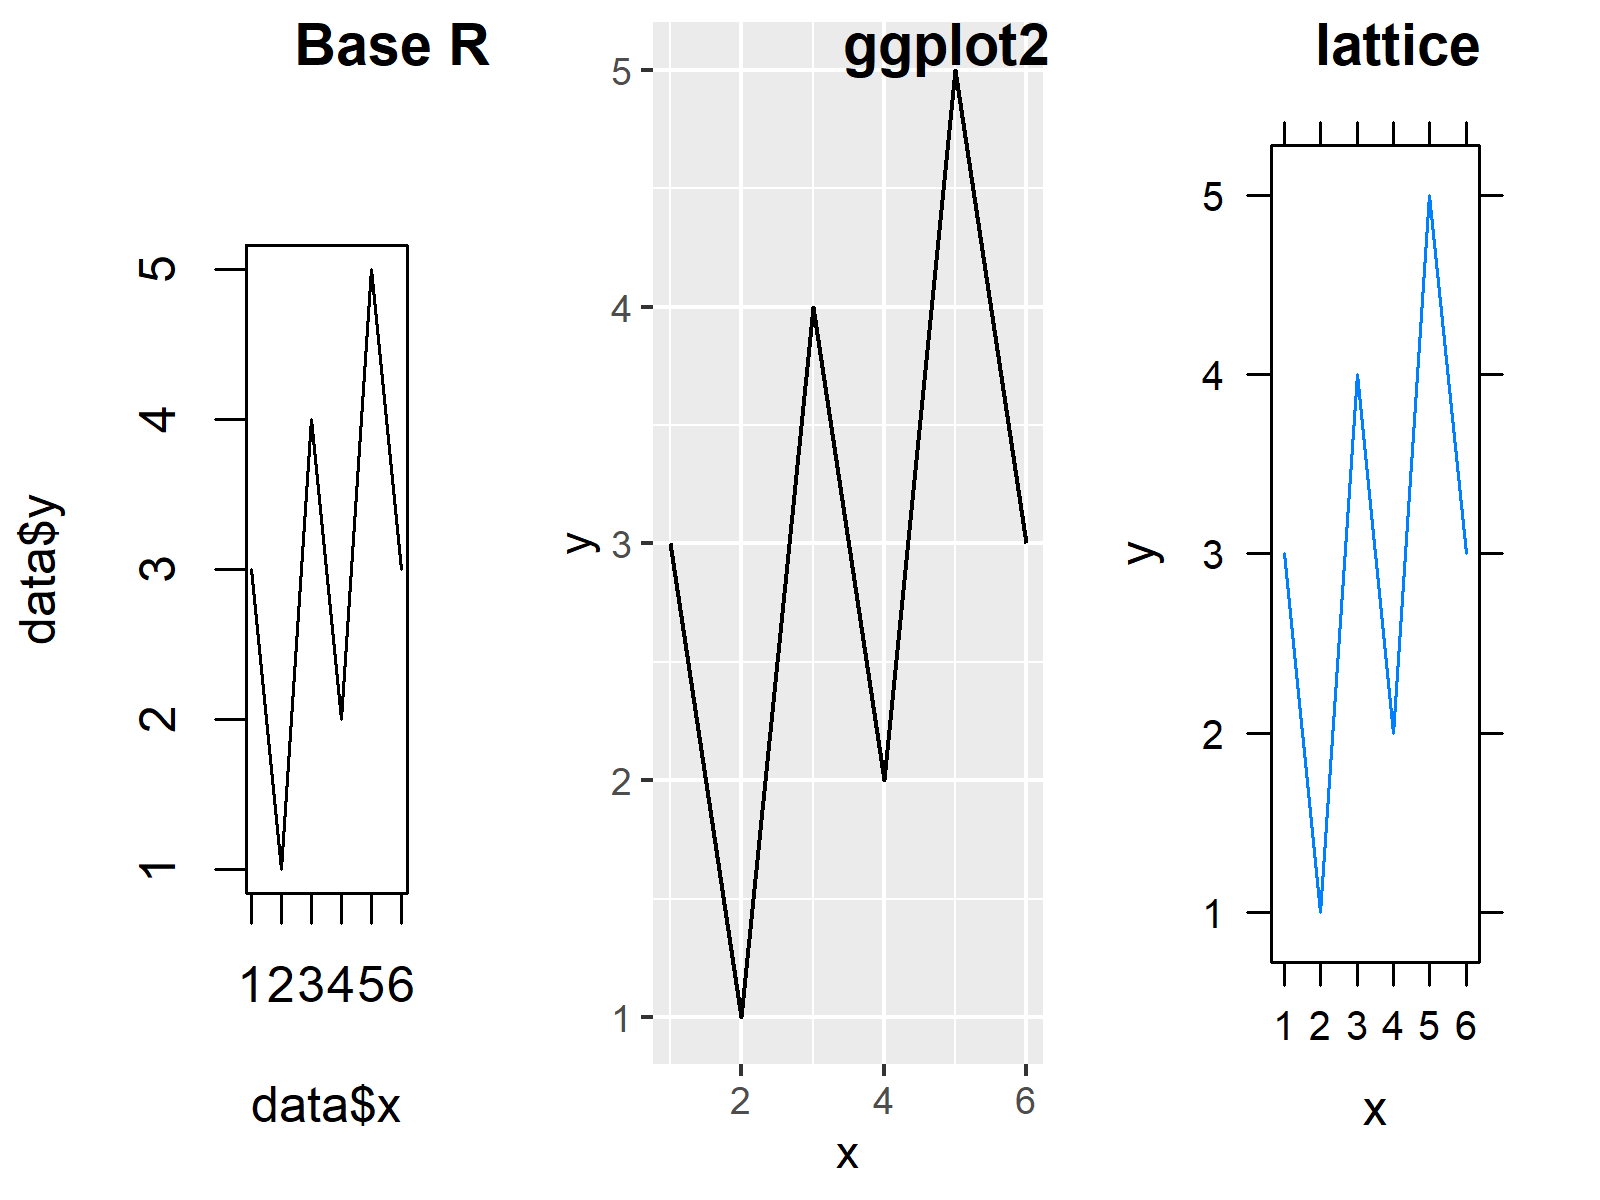
Figure 4 shows the output of the previous R code: A grid of Base R, ggplot2, and lattice graphics.
Example 2: Create Grid of Plots Using ggplotify & patchwork Packages
In Example 2, I’ll demonstrate how to use the ggplotify and patchwork packages to create a plot composition containing Base R, ggplot2, and lattice plots.
First, we need to install and load the ggplotify package to RStudio:
install.packages("ggplotify")                         # Install ggplotify package
library("ggplotify")                                  # Load ggplotify
We then have to install and load the patchwork add-on package, if we want to use the corresponding functions:
install.packages("patchwork")                         # Install & load patchwork
library("patchwork")
Now, we can use the as.ggplot function of the ggplotify function in combination with the typical patchwork syntax to draw a grid of plots:
as.ggplot(~plot(data$x, data$y, type = "l")) +        # Create grid of plots
  my_ggplot +
  as.ggplot(my_lattice)
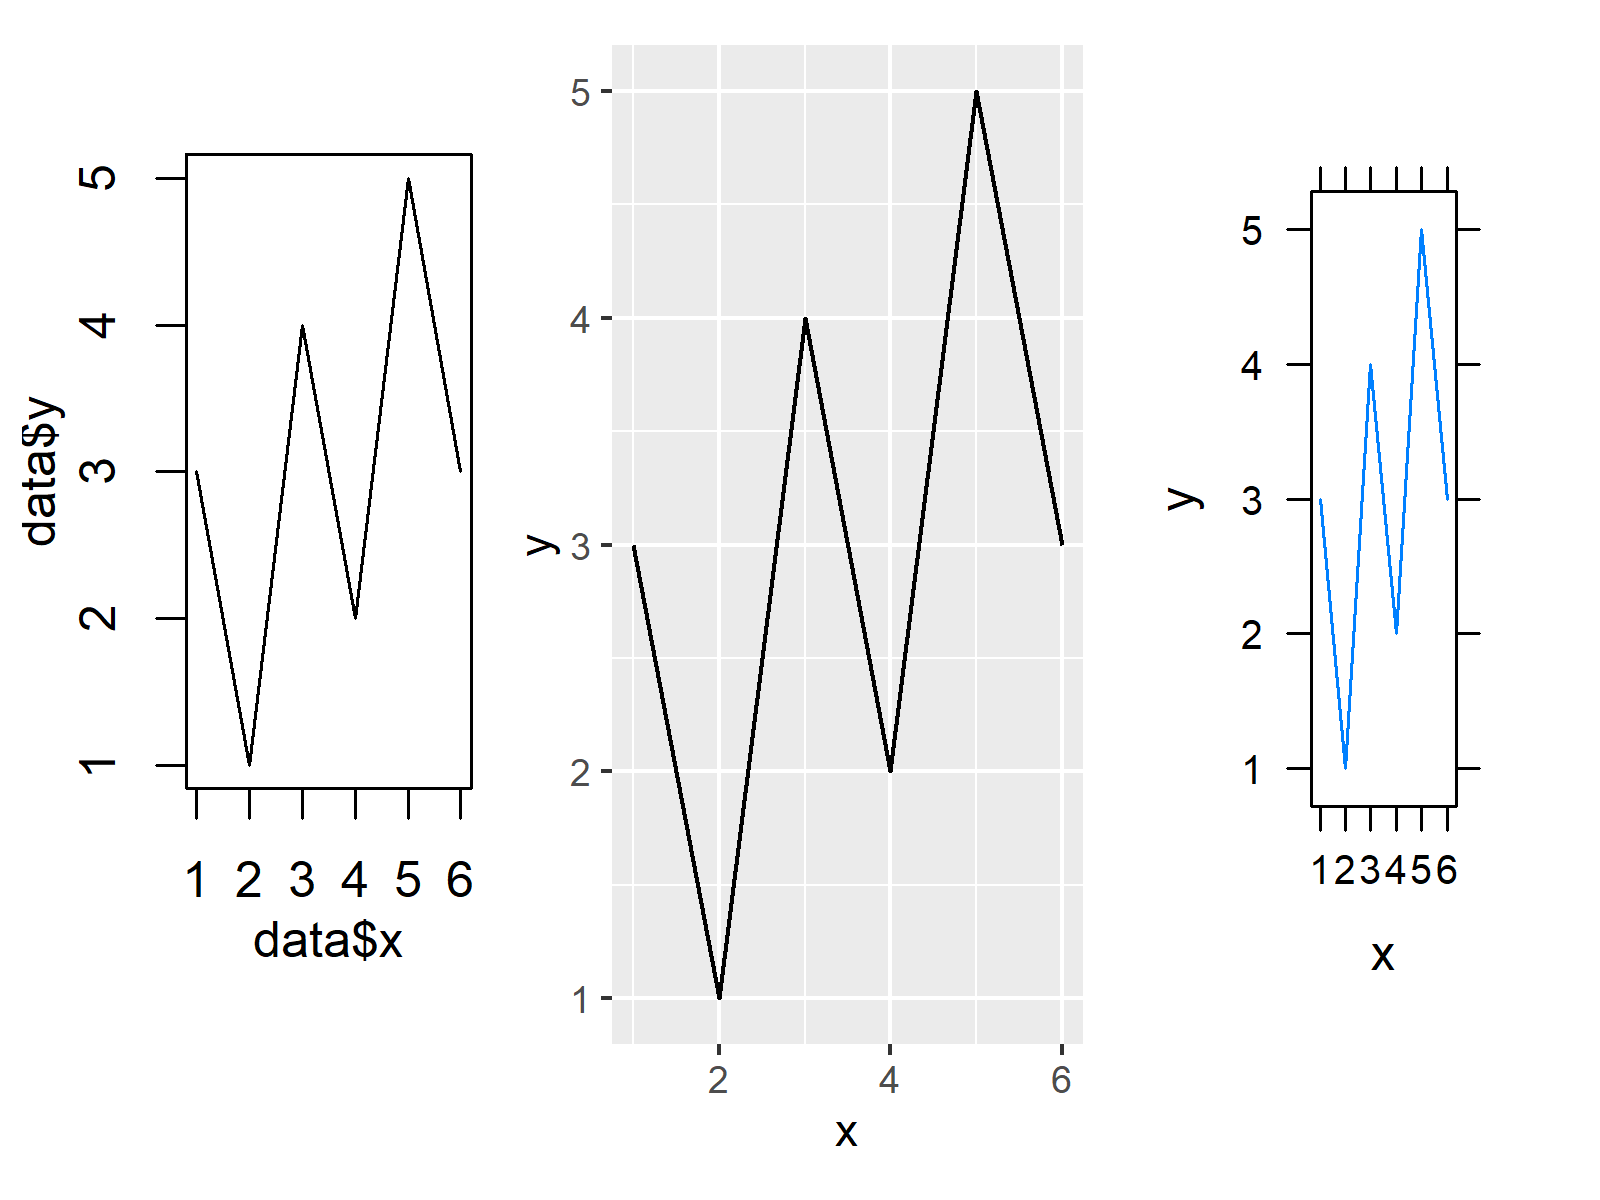
As you can see in Figure 5, the previous R code has created a composition of our three plots.
Video, Further Resources & Summary
Have a look at the following video on my YouTube channel. In the video, I’m explaining the content of this tutorial in RStudio:
In addition, you may read some of the related tutorials on my website. I have published numerous articles about related topics such as graphics in R and ggplot2.
- Draw Multiple ggplot2 Plots Side-by-Side
- Insert PNG Image Between Certain ggplot2 Axis Positions
- Combine Two ggplot2 Plots from Different Data Frames
- Common Main Title for Multiple Plots in Base R & ggplot2
- Creating Plots in R
- R Programming Overview
In this tutorial you have learned how to draw a grid of Base R, ggplot2, and lattice plots in the R programming language. Let me know in the comments below, in case you have further questions.


