Change Legend Size of Plot in Python Matplotlib & seaborn (2 Examples)
Hi! This tutorial will show you how to adjust the legend size of a plot in Matplotlib and seaborn in the Python programming language.
Here is an overview:
Let’s get into the Python code!
Install & Import Matplotlib, seaborn & pandas Libraries
First, you will need to install and import Matplotlib, seaborn and pandas libraries into your Python programming environment, if you do not already have them installed and imported.
Therefore, in your preferred Python IDE, run the code below to install and import all three libraries:
# install Matplotlib, seaborn & pandas
pip install matplotlib seaborn pandas

# import Matplotlib, seaborn & pandas
import matplotlib.pyplot as plt

import seaborn as sns

import pandas as pd
We need pandas to create the DataFrame that will be used in the examples in this tutorial. The Python pandas library is the foremost library for data manipulation and analysis in Python.
With all three libraries installed and imported, we will now create the example dataset that we will use in the examples in this tutorial.
Create Example Dataset
We will be creating a simple line plot in Matplotlib and a joint plot in seaborn using the same dataset.
Therefore, run the code below to create the example dataset:
data_dict = {"Age":[25, 44, 20, 58, 65],
             "Weight":[45, 57, 62, 50, 75],
             "Sex":["Female","Male","Male","Female","Male"]}

df = pd.DataFrame(data_dict)

print(df)

#    Age  Weight     Sex
# 0   25      45  Female
# 1   44      57    Male
# 2   20      62    Male
# 3   58      50  Female
# 4   65      75    Male
We first created a dictionary object, and then parsed that to the pd.DataFrame() method to create the DataFrame.
So, now that we have created the example dataset let us build basic visualizations to demonstrate how to modify the legend size of plots in Matplotlib and seaborn.
Example 1: Adjust Legend Size of Plot in Matplotlib
In this example, we will first build a basic line plot with the default legend size. Then, we will demonstrate how to modify the legend size.
Run the code below to build a basic line plot with the default legend size:
plt.plot(df["Age"])

plt.plot(df["Weight"])

plt.legend(["age", "weight"], loc ="upper left")

plt.show()

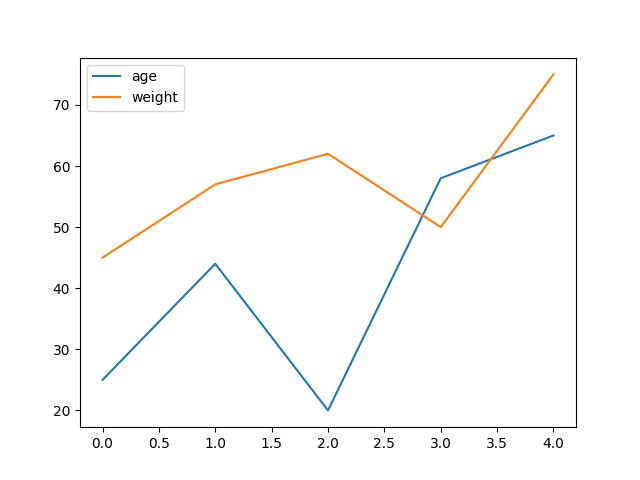
As you can see in the plot above, the legend size is the default size after building the plot using the plt.plot() function.
The only thing we set was the legend position in the plt.legend() function, wherein we defined the loc = argument as “upper left”, so that the legend appears at the upper left part of the plot.
Now, let us increase the legend size. Run the code below to do that:
plt.plot(df["Age"])

plt.plot(df["Weight"])

plt.legend(["age", "weight"], fontsize = "20", loc ="upper left")

plt.show()

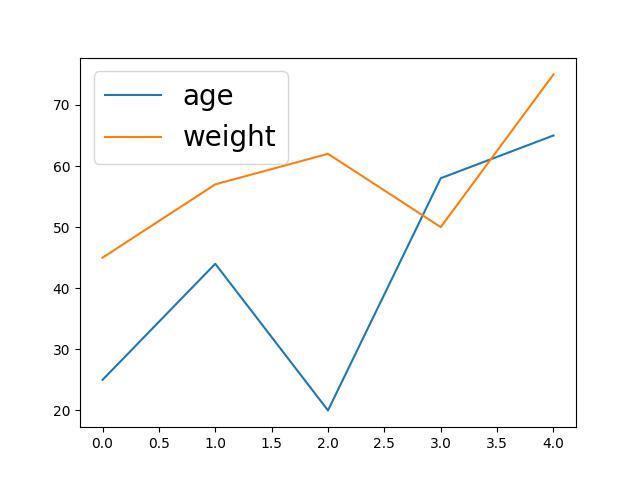
In the plot above, you can clearly notice that the legend size is significantly larger than the default.
To accomplish this, we simply introduced and defined a new argument fontsize = and parsed “20” to it in the plt.legend() function.
Doing so changes the default legend size. Note that if you also parse a small number to the fontsize = argument, say “7”, you will get a significantly smaller legend.
Example 2: Adjust Legend Size of Plot in seaborn
As we did in the Matplotlib example, we will first build a basic joint plot with the default legend size and then demonstrate how to adjust the legend size. Run the code below to build the basic plot:
sns.jointplot(df,x = "Age",y = "Weight", hue = "Sex")

plt.legend()

plt.show()

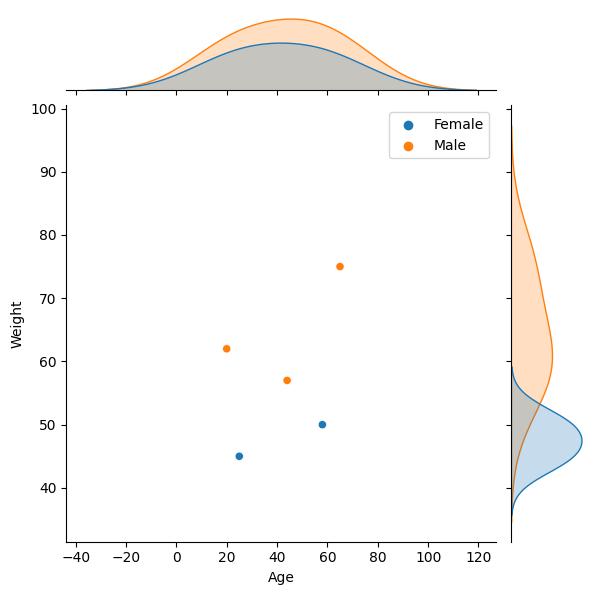
In the above example, we first created the plot using the sns.jointplot() function wherein we parsed the DataFrame and the columns in the DataFrame that we want to plot.
We also colored the data points by the Sex column in the DataFrame.
However, the legend size is the default, which we would like to change. To alter the legend size, run the code below:
sns.jointplot(df,x = "Age",y = "Weight", hue = "Sex")

plt.legend(fontsize = "7")

plt.show()

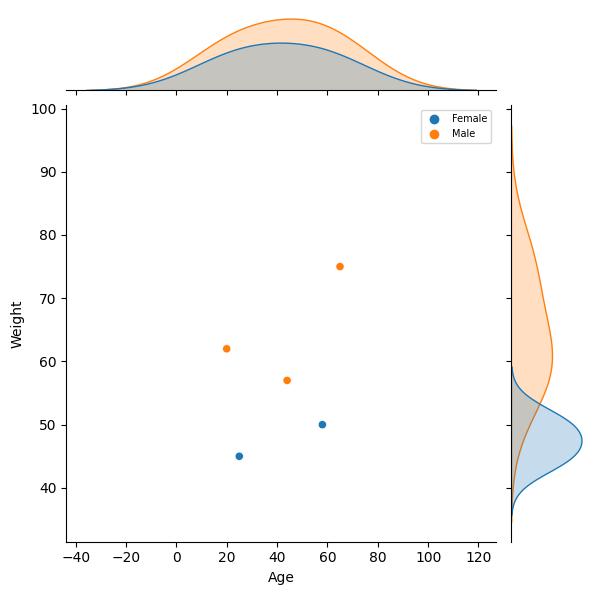
As you will notice, we have significantly reduced the size of the legend in the plot above. We did this by defining the fontsize = argument as “7” in the plt.legend() function.
The syntax is very similar to that in the Matplotlib example. This is because seaborn is a library built on top of Matplotlib; so they share similarities.
Also, you can increase the legend size by giving a higher number to the fontsize = argument.
Video, Further Resources & Summary
Do you need more explanations on how to adjust the legend size of a plot in Matplotlib and seaborn in Python? Then you should have a look at the following YouTube video of the Statistics Globe YouTube channel.
In the video, we explain in some more detail how to adjust the legend size of a plot in Matplotlib and seaborn in Python.
The YouTube video will be added soon.
In addition, you might read the other posts on this homepage.
- Add Legend to Plot in Python Matplotlib & seaborn (4 Examples)
- Change Axis Labels of Plot in Python Matplotlib & seaborn (2 Examples)
- Change Font Size of Plot in Python Matplotlib & seaborn (2 Examples)
- Introduction to Python Programming
This post has shown how to adjust the legend size of a plot in Matplotlib and seaborn in Python. In the present tutorial, we have adjusted the legend size of a line plot and a joint plot. However, you may use the same syntax to change the legend size of other types of plots, such as boxplots, histograms, heatmaps, density plots, and so on.
I do hope you found this tutorial helpful! In case you have further questions, you may leave a comment below.
This page was created in collaboration with Ifeanyi Idiaye. You might check out Ifeanyi’s personal author page to read more about his academic background and the other articles he has written for the Statistics Globe website.


