Change Font Size in corrplot in R (3 Examples)
This article demonstrates how to adjust the font size in a corrplot in the R programming language.
Table of contents:
So without further additions, let’s get started!
Example Data, Packages & Default Plot
The first step is to construct some data that we can use in the exemplifying syntax below:
set.seed(359478)                        # Create example data
data <- matrix(rnorm(100), ncol = 10)
data                                    # Print example data
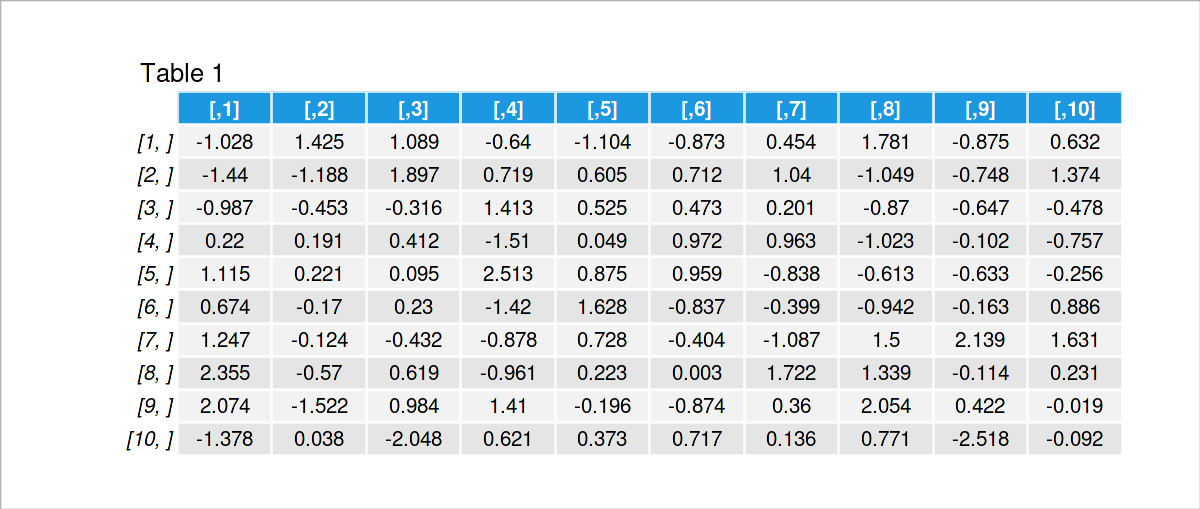
As you can see based on Table 1, our example data is a matrix having ten rows and ten columns.
To be able to use the functions of the corrplot package, we also need to install and load corrplot:
install.packages("corrplot")            # Install & load corrplot package
library("corrplot")
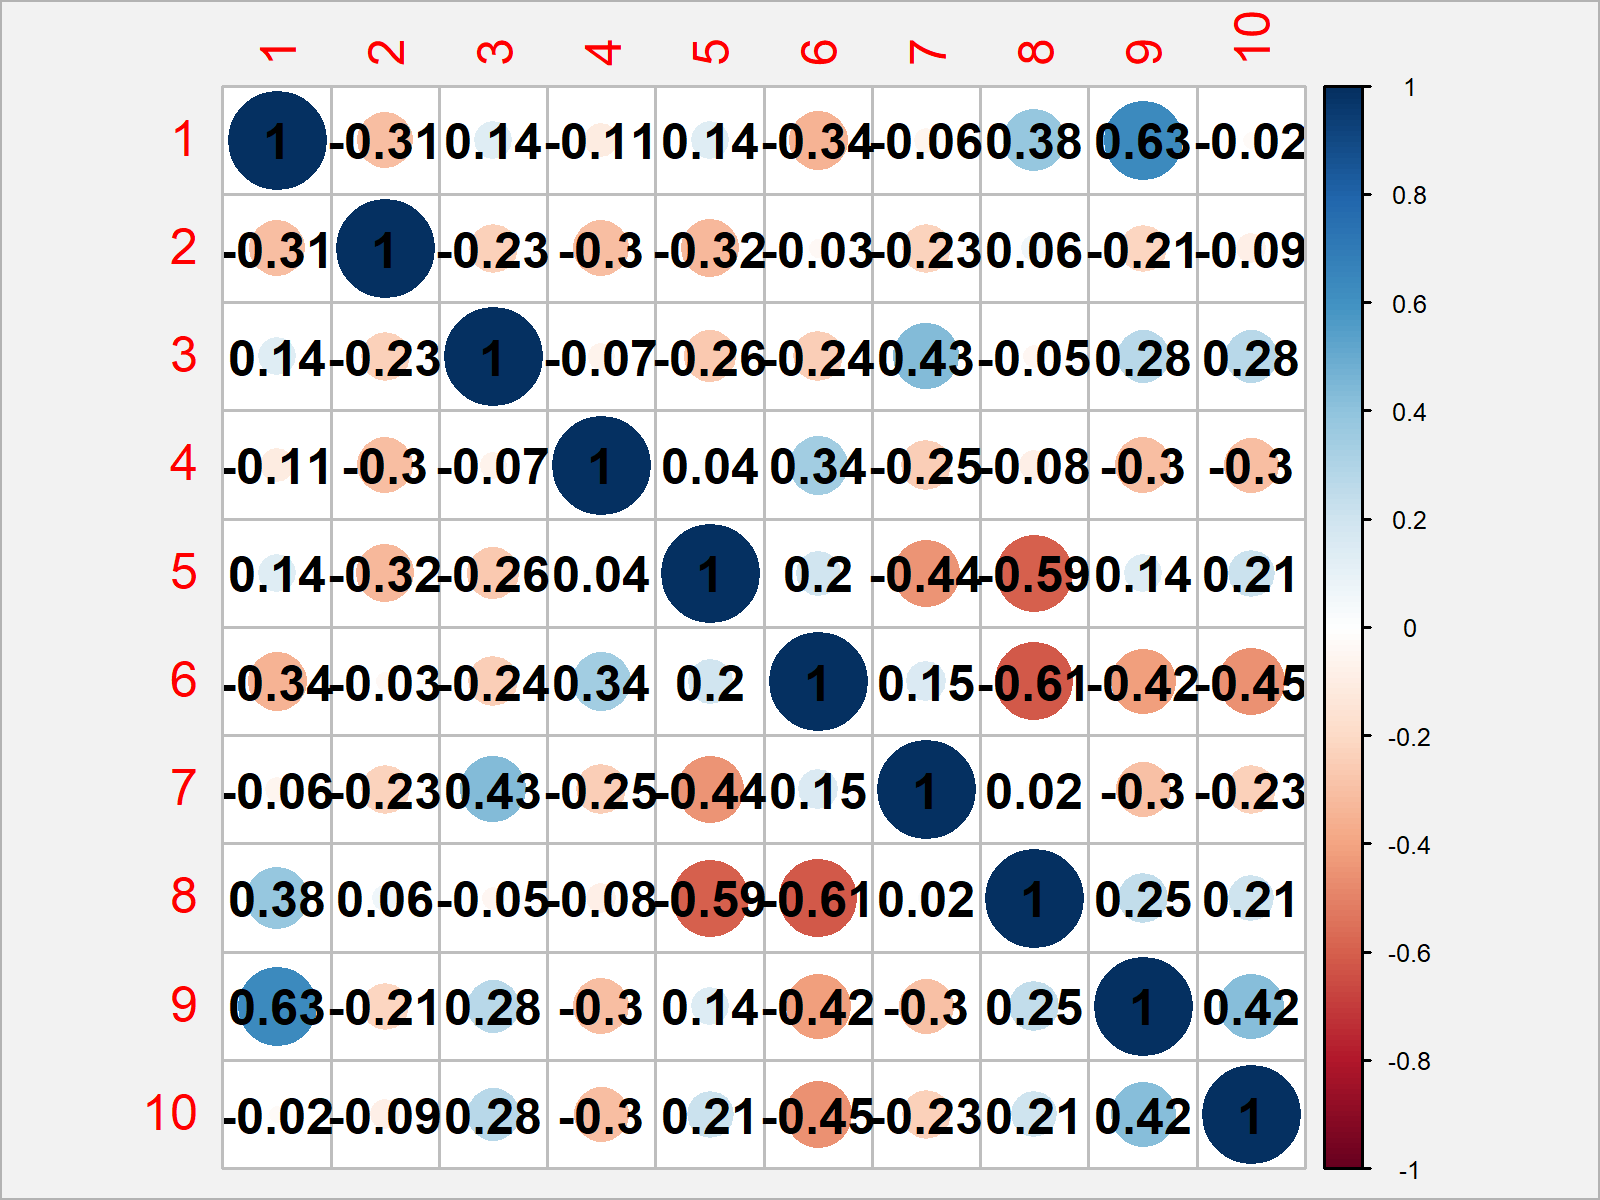
As a next step, we can draw our data in a corrplot correlation matrix with default font sizes:
corrplot(cor(data), addCoef.col = 1) # Draw corrplot with default font size
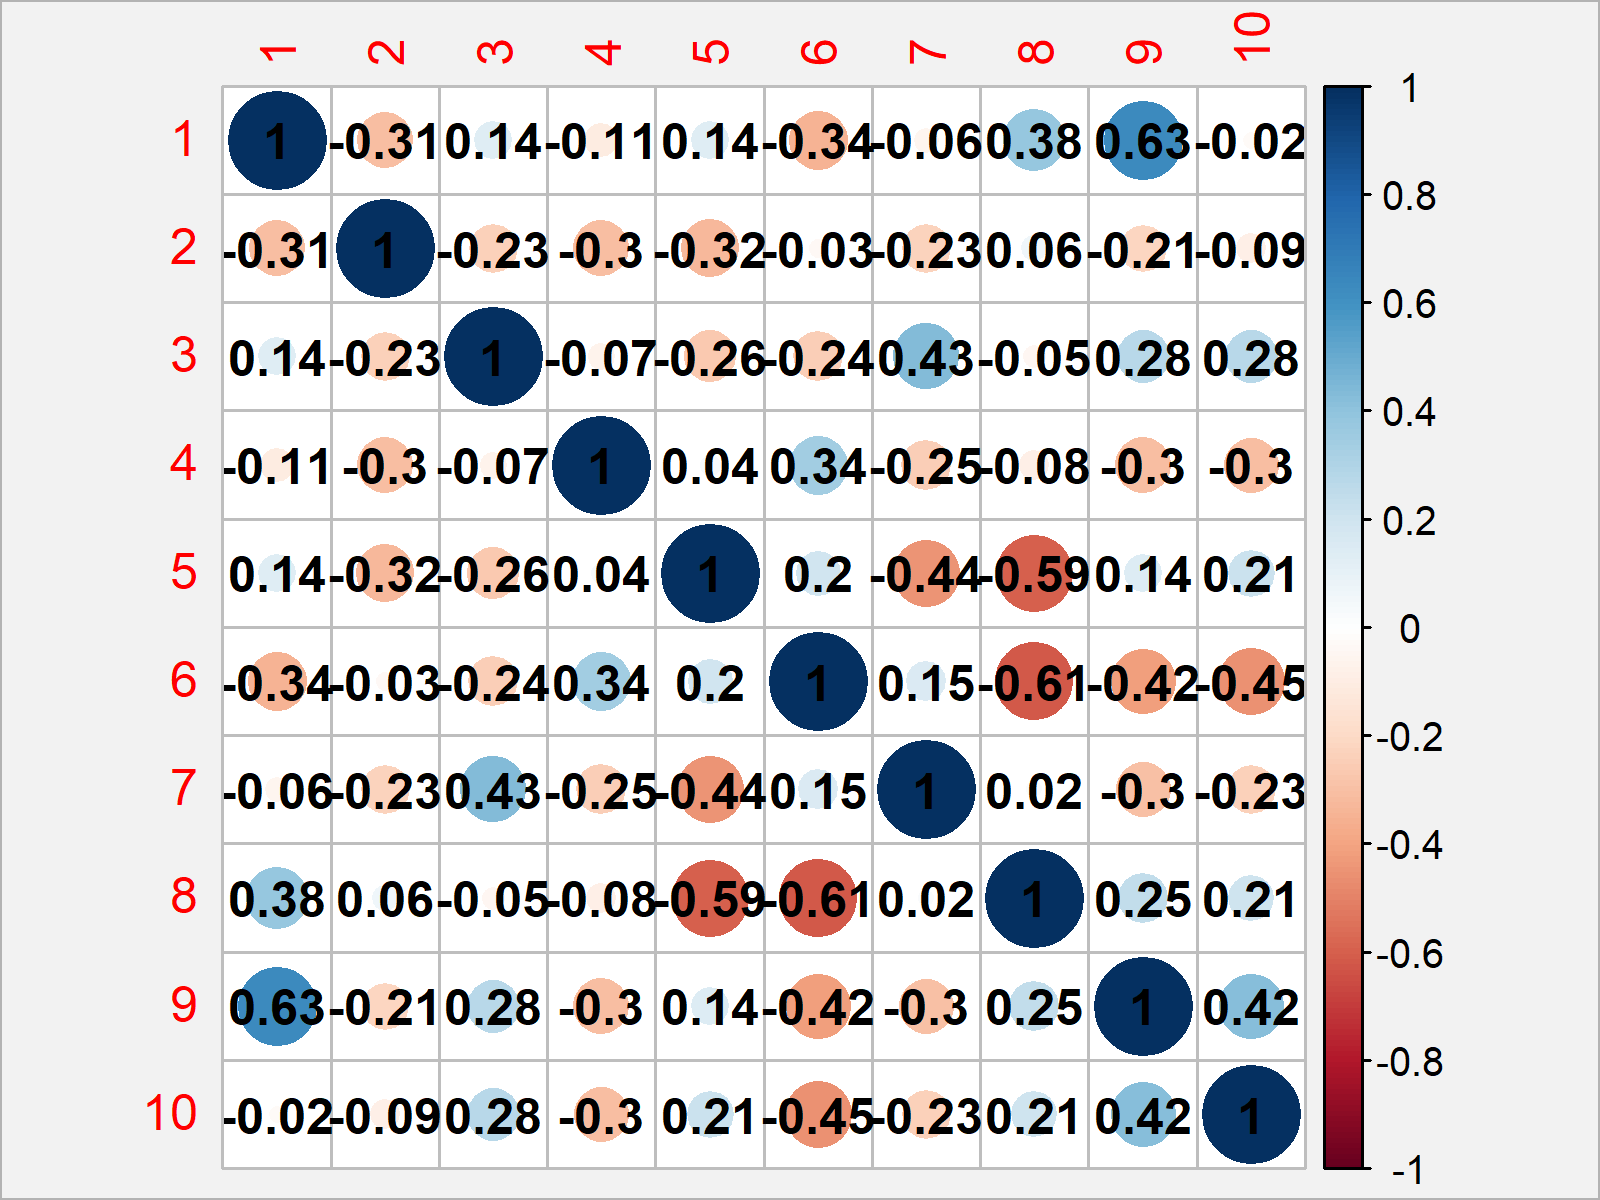
The following examples will show how to change the font sizes of different elements of this corrplot. Keep on reading!
Example 1: Adjust Font Size of Correlation Coefficients in corrplot
This example shows how to decrease the text size of the correlation coefficients in a corrplot.
For this, we have to specify a smaller value to the number.cex argument. The smaller this value is, the smaller is the font size (or the larger).
Have a look at the following R code and its output:
corrplot(cor(data), addCoef.col = 1,    # Change font size of correlation coefficients
         number.cex = 0.5)
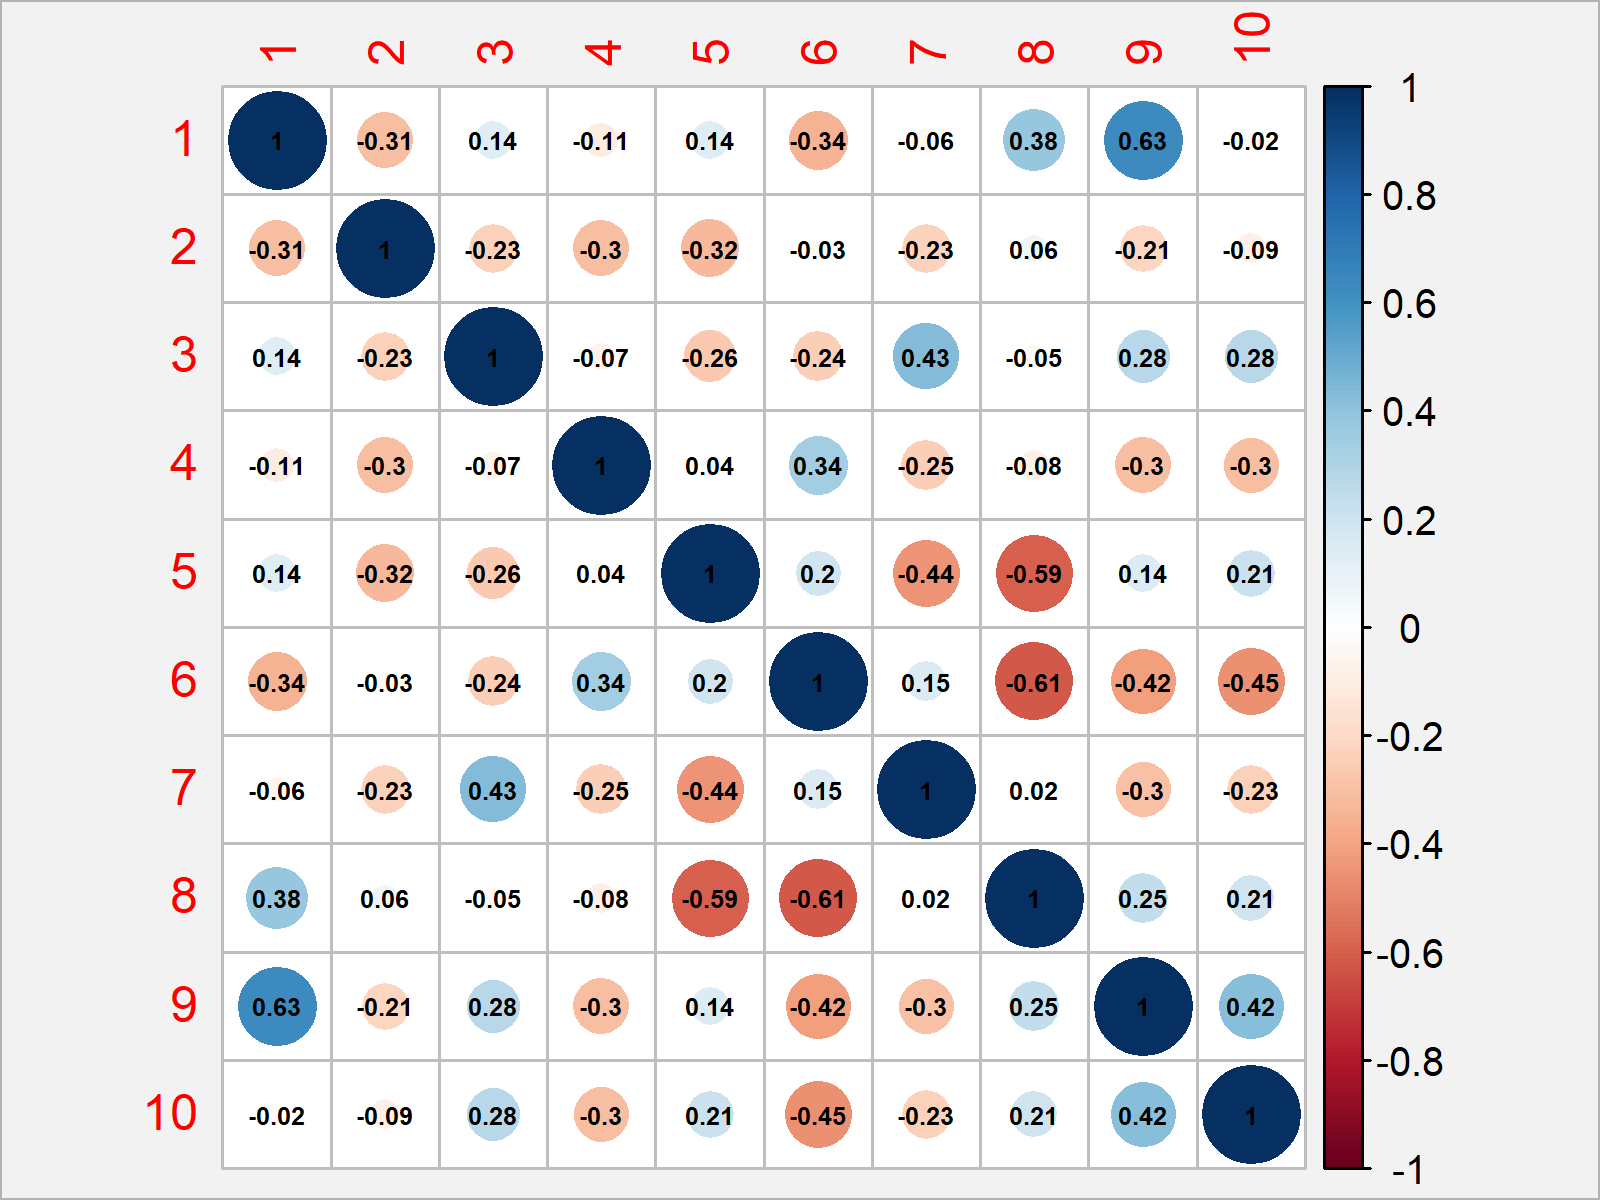
As you can see, we have modified the size of the correlation coefficients in our plot.
Example 2: Adjust Font Size of Text Labels in corrplot
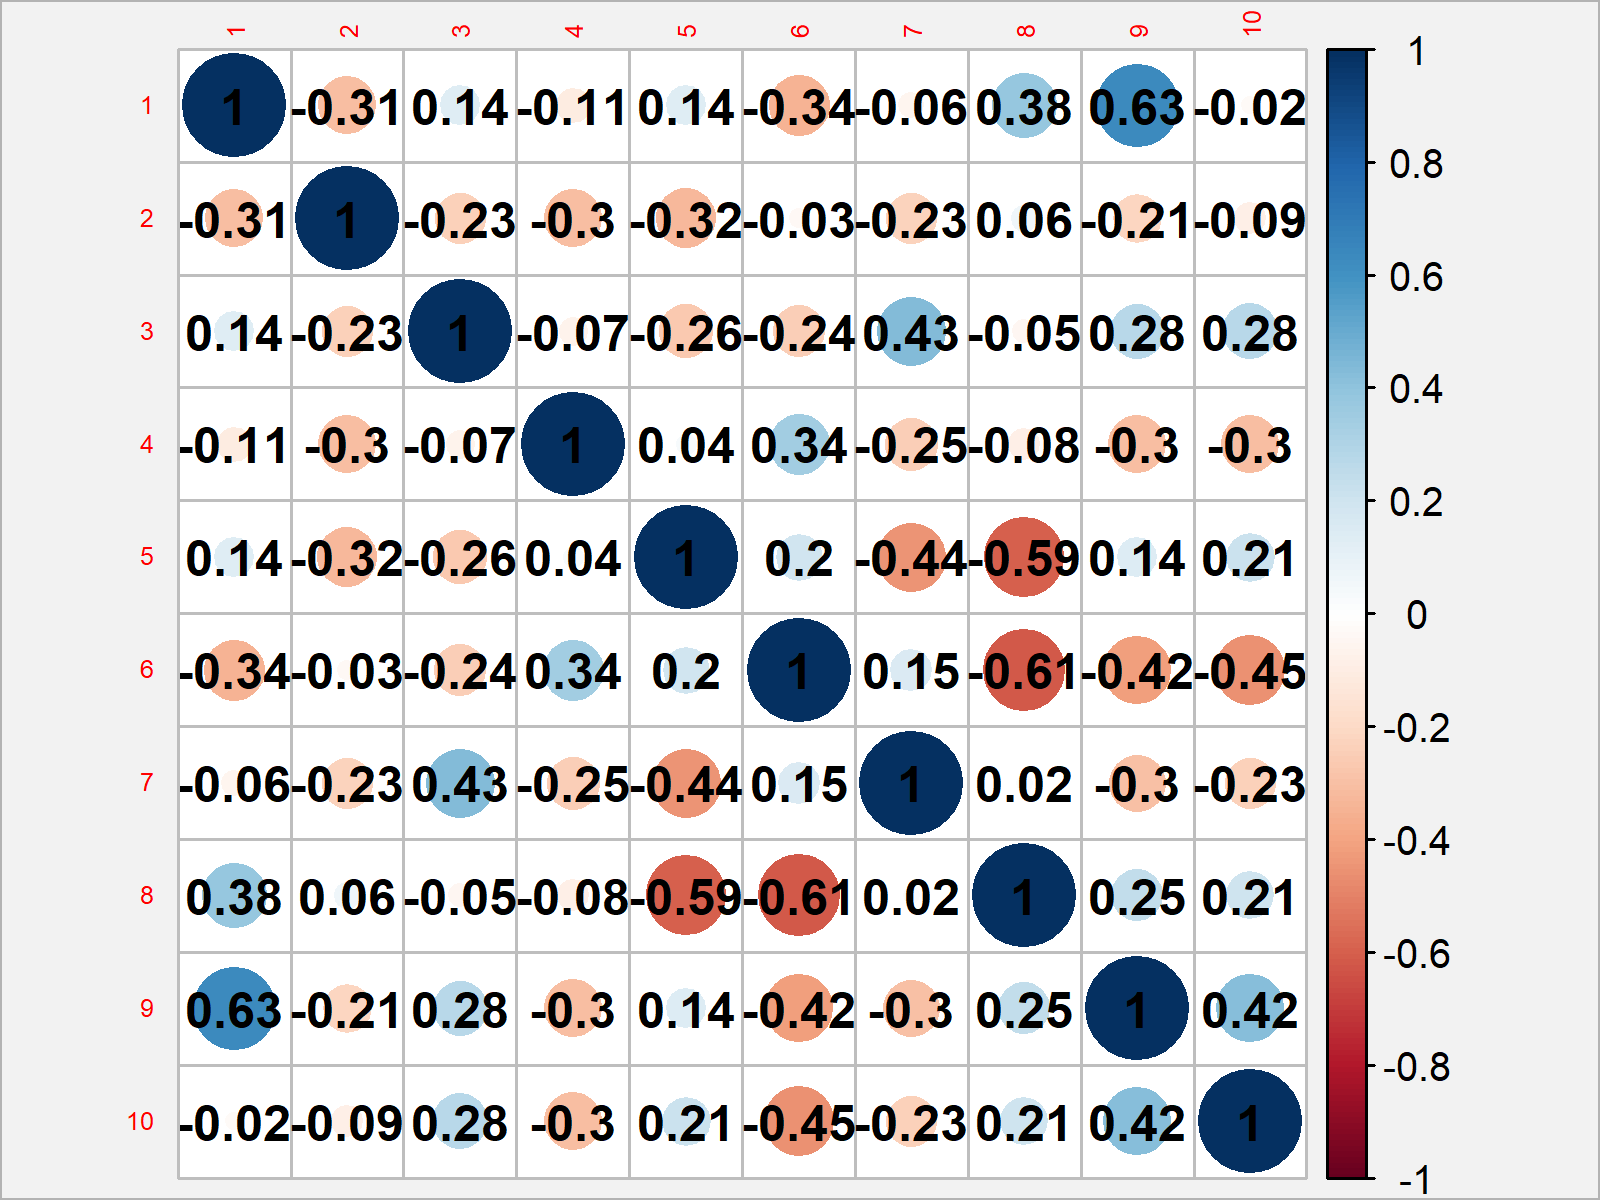
The following code shows how to change the font size of the text labels at the axes of our corrplot (i.e. the variable names).
To do this, we have to specify a different value for the tl.cex argument:
corrplot(cor(data), addCoef.col = 1,    # Change font size of text labels
         tl.cex = 0.5)
Example 3: Adjust Font Size of Number-Labels in Color-Legend in corrplot
In Example 3, I’ll show how to change the text size of the legend labels.
In this example, we have to modify the cl.cex argument:
corrplot(cor(data), addCoef.col = 1,    # Change font size of number-labels in color-legend
         cl.cex = 0.5)
Video, Further Resources & Summary
Do you want to learn more about the adjustment of the font size of different numbers in a corrplot? Then you may want to have a look at the following video which I have published on my YouTube channel. In the video, I demonstrate the R programming codes of this tutorial in a live session.
In addition, you may have a look at the other tutorials on this website. I have published several related articles already:
- Correlation Matrix in R
- Change Font Size of ggplot2 Plot
- Change Font Size of ggplot2 Facet Grid Labels
- Graphics in R
- R Programming Examples
Summary: At this point you should have learned how to increase or decrease the font size in a corrplot in R. Don’t hesitate to let me know in the comments section, if you have further questions.


1 Comment. Leave new
This article saved so much time. Precise and on point!! Thanks!