R ggplot2 Error: Mapping should be created with `aes()` or `aes_()`.
In this R tutorial you’ll learn how to debug the ggplot2 error message “Error: Mapping should be created with `aes()` or `aes_()`.”.
The content of the article is structured as follows:
It’s time to dive into the exemplifying R code…
Example Data & Packages
First, let’s create some example data:
data <- data.frame(x = 5:1,        # Create example data
                   y = 10:6)
data                               # Print example data

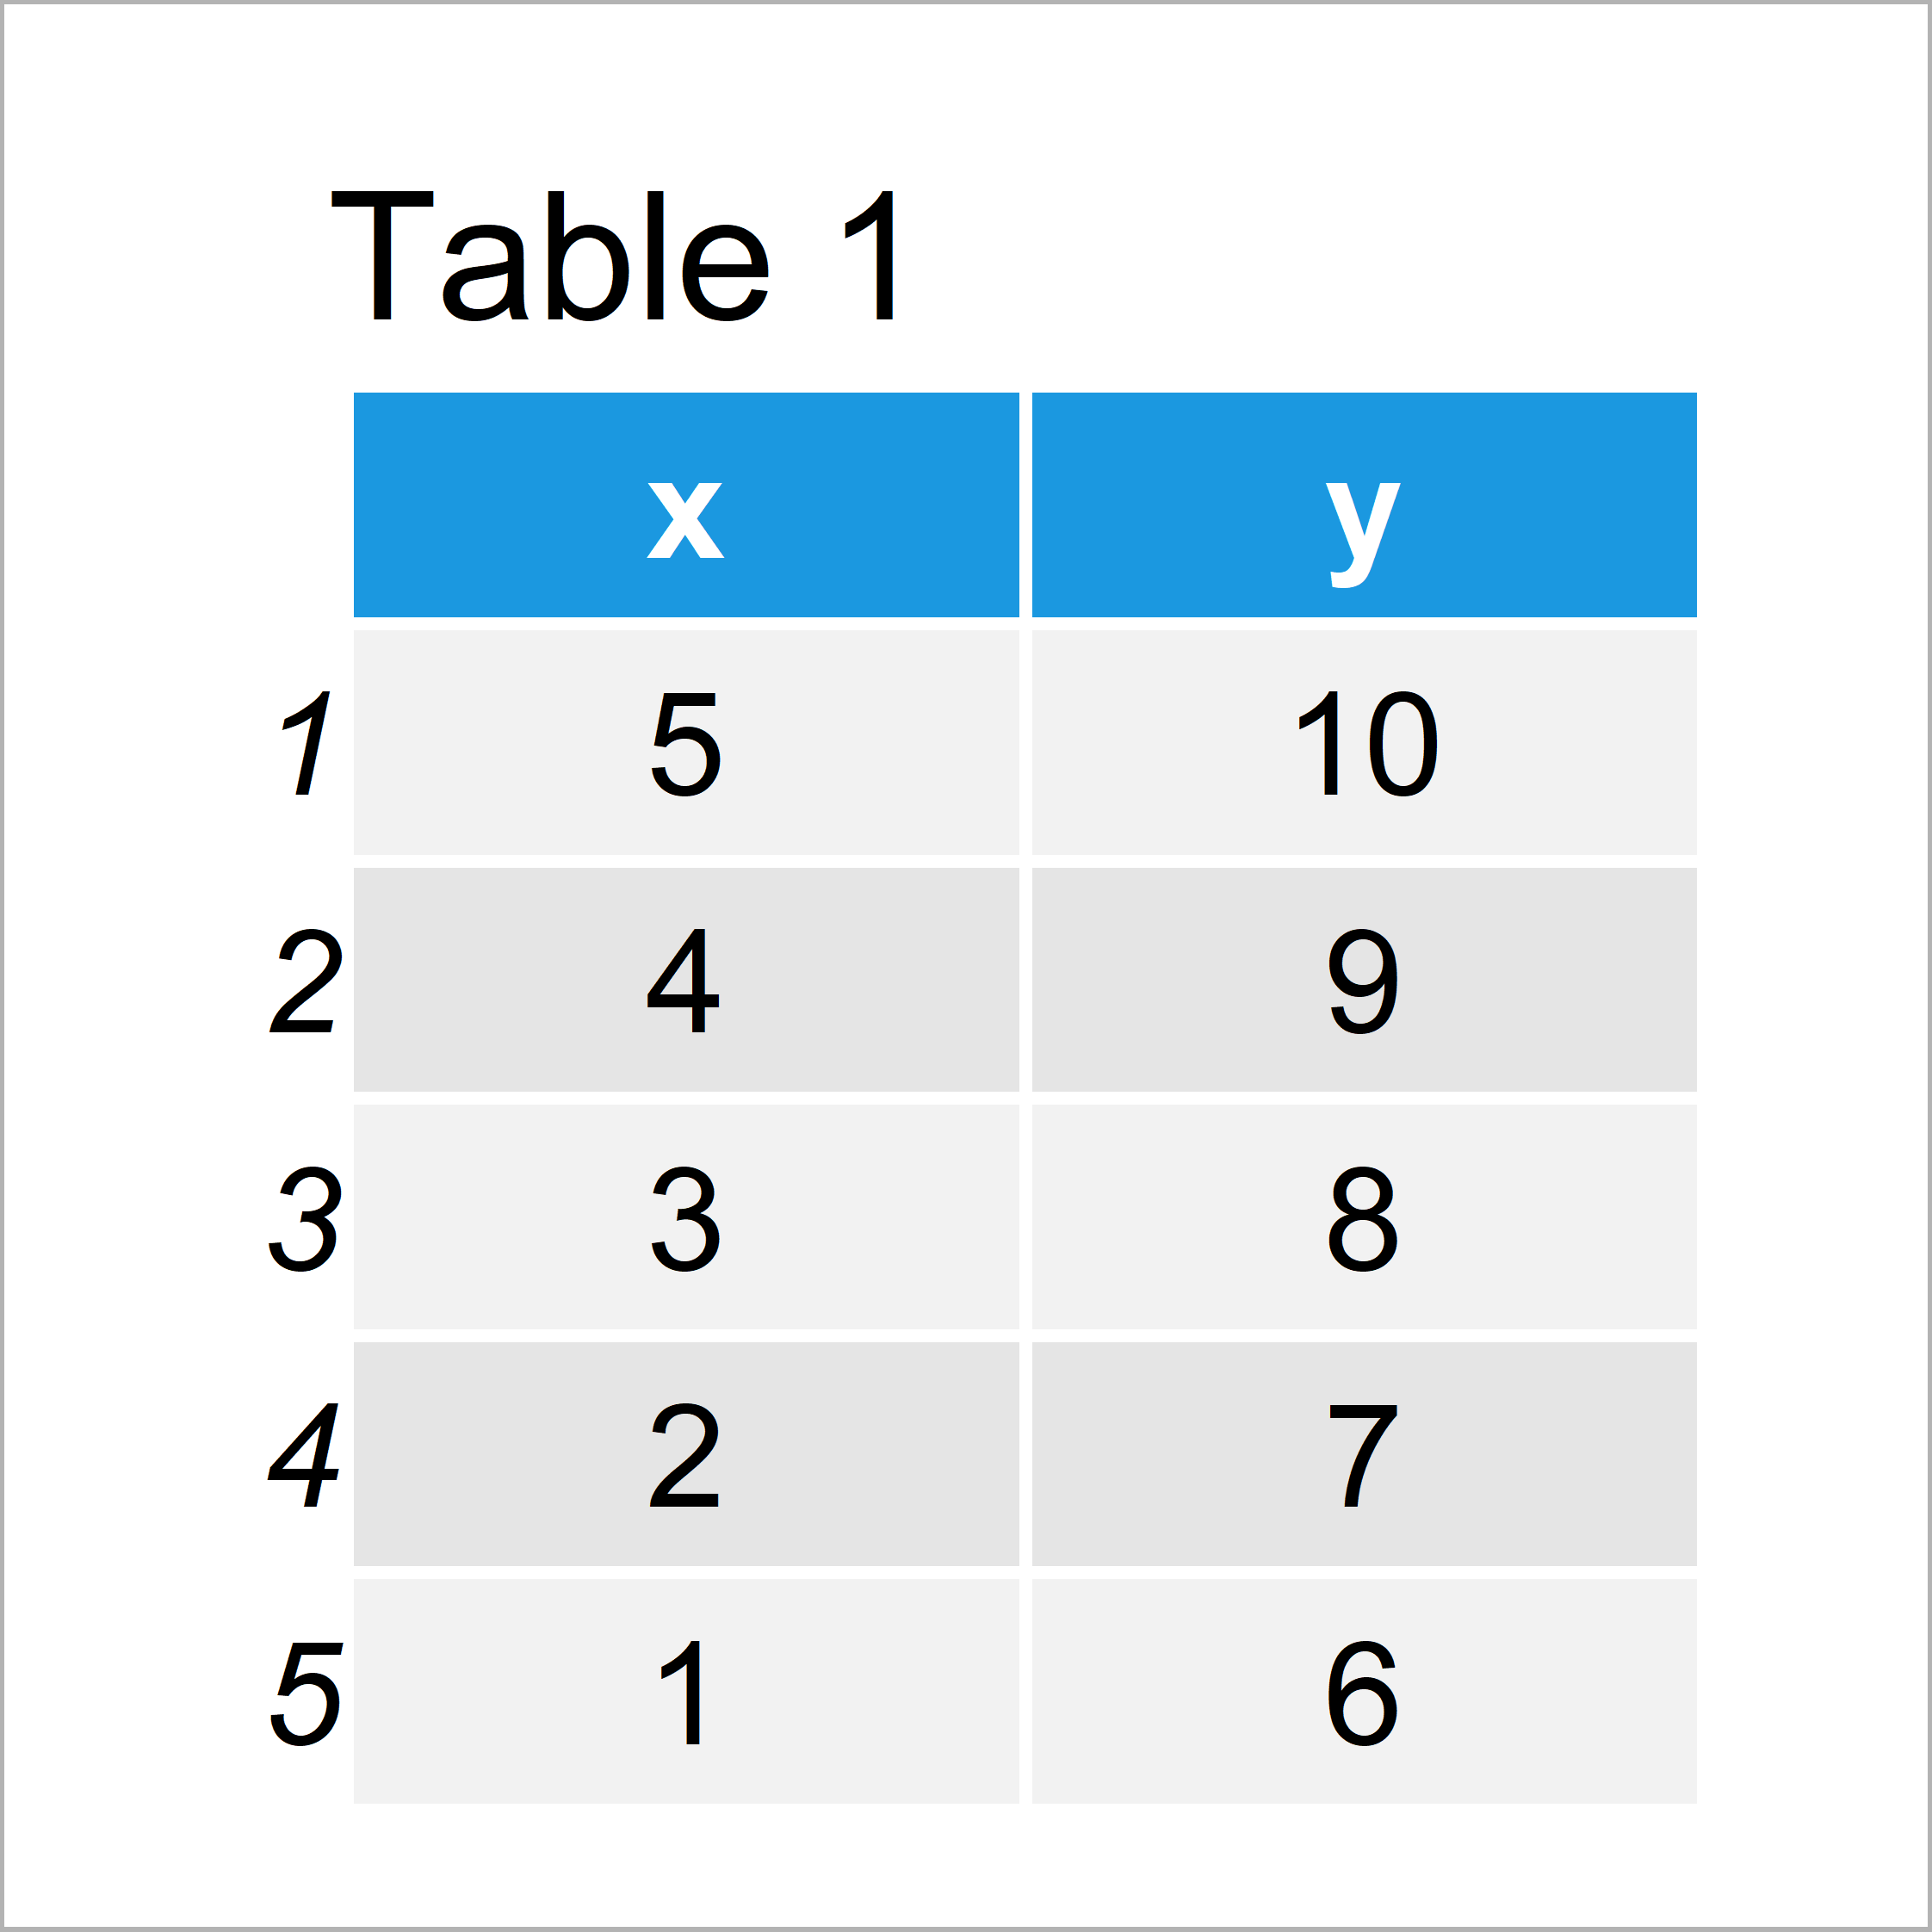
The previous table illustrates the output of the RStudio console returned after running the previous syntax and shows that our exemplifying data is constituted of five rows and two columns with the names “x” and “y”.
For the examples of this tutorial, we also need to install and load the ggplot2 package.
install.packages("ggplot2")        # Install ggplot2 package
library("ggplot2")                 # Load ggplot2 package
Now, we are set up and can move on to the examples!
Example 1: Reproduce the Error – Mapping should be created with `aes()` or `aes_()`.
This example demonstrates how to replicate the “Error: Mapping should be created with `aes()` or `aes_()`.” when using the ggplot2 package in the R programming language.
Have a look at the following R code:
ggplot(data, aes(x, y) +           # Reproduce error message
         geom_point())
# Error: Mapping should be created with `aes()` or `aes_()`.
As you can see, the previous R code returned the error message “Error: Mapping should be created with `aes()` or `aes_()`.” to the RStudio console.
The reason for this is that we have put the last parenthesis at the wrong position (i.e. after geom_point).
So where should we put this parenthesis, and how can we debug this error message? That’s what I’ll explain next!
Example 2: Debug the Error – Mapping should be created with `aes()` or `aes_()`.
In Example 2, I’ll show how to solve the problems with the “Error: Mapping should be created with `aes()` or `aes_()`.”.
For this we have to move the very las parenthesis one line upwards in front of the + sign.
Consider the R syntax below:
ggplot(data, aes(x, y)) +          # Fix error message
  geom_point()

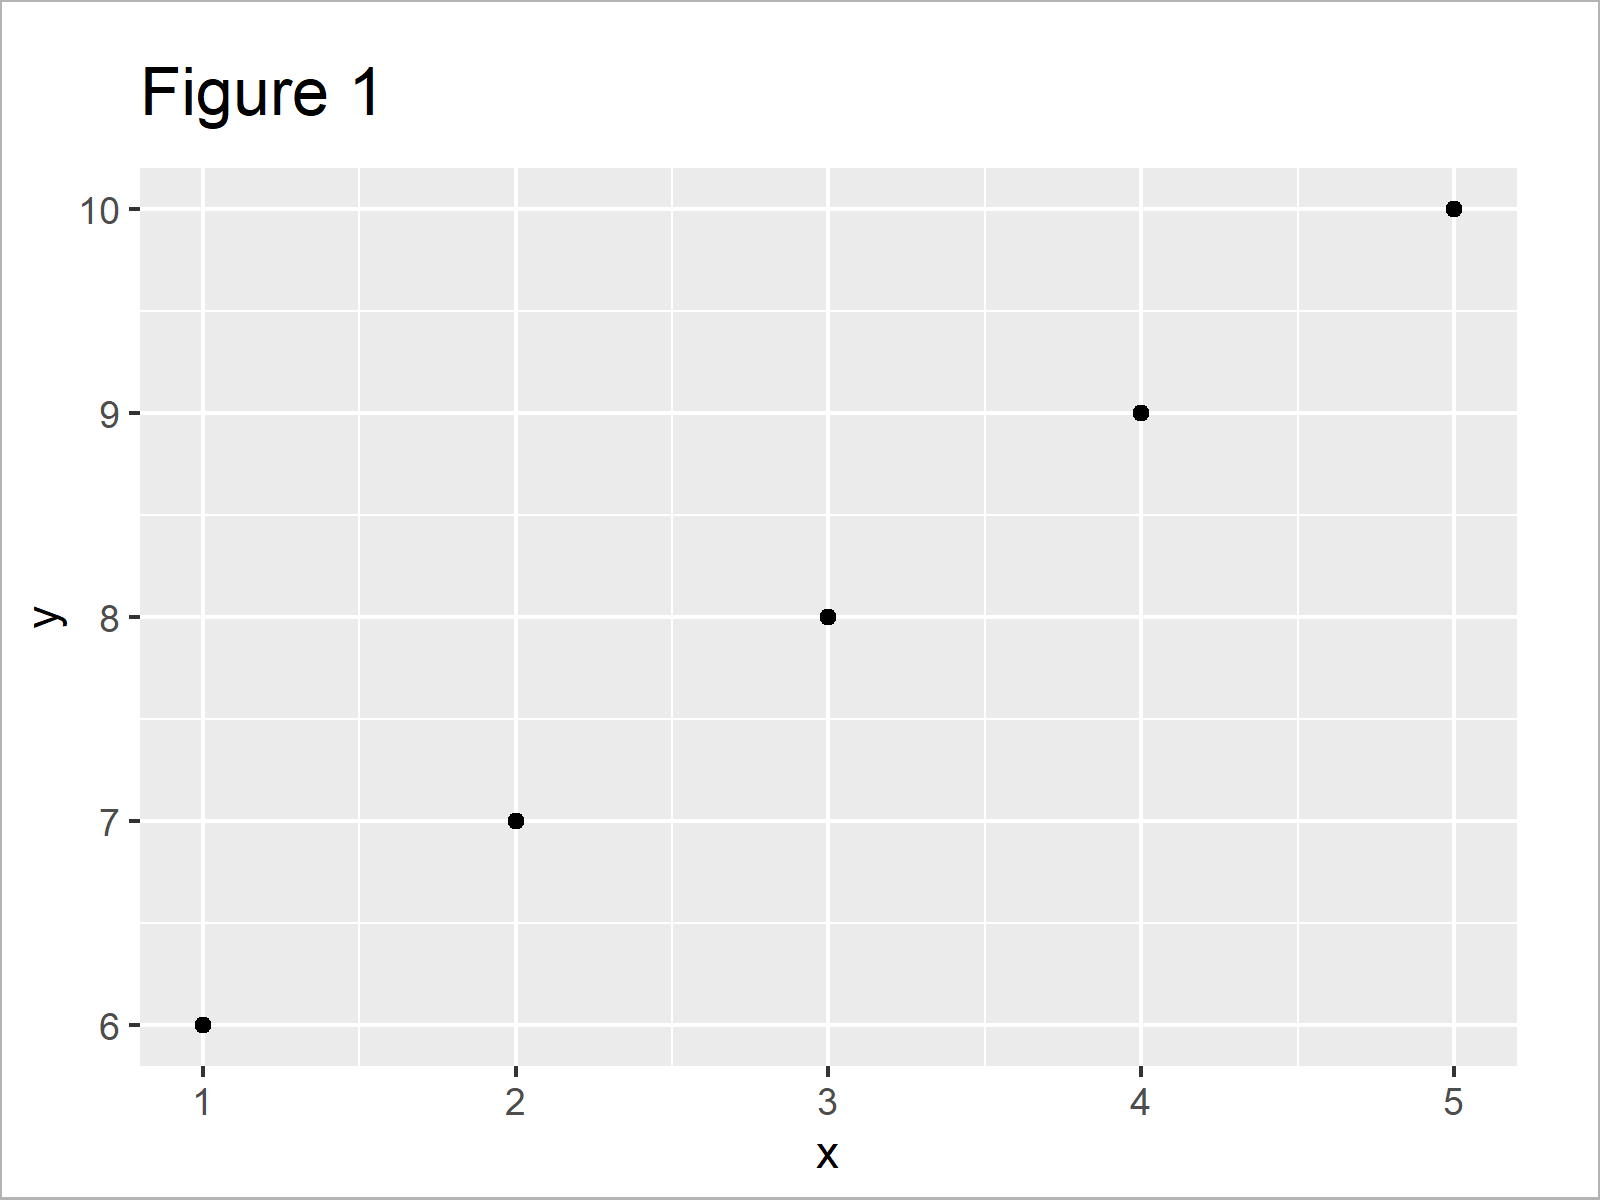
As you can see, we have not received an error message. Instead, the graphic shown in Figure 1 has been created.
Video, Further Resources & Summary
Have a look at the following video which I have published on my YouTube channel. In this tutorial, I give a detailed introduction to the ggplot2 Package and data visualization in R, structured in different sections with examples for beginners but also advanced users.
Also, you could have a look at the related articles of this homepage.
- Error in hist.default : ‘x’ must be numeric
- ggplot2 Error: Aesthetics must be either length 1 or the same as the data
- ggplot2 Error in R: “`data` must be a data frame, or other object coercible by `fortify()`, not an integer vector”
- Solving Errors & Warnings in R
- Graphics Overview in R
- Introduction to R
In summary: In this R tutorial you have learned how to deal with the ggplot2 error message “Error: Mapping should be created with `aes()` or `aes_()`.”. Let me know in the comments, in case you have additional questions.


2 Comments. Leave new
Grear! This tutorial helps a lot.
That’s very nice to hear Jiwan, thanks for the comment! 🙂