Arrange Boxplot of Multiple Y-Variables for Groups of Continuous X in R (Example)
In this R tutorial you’ll learn how to split a continuous variable into boxplot-groups.
Table of contents:
Sound good? Let’s dive right in…
Example Data, Packages & Basic Graphic
The first step is to create some example data:
set.seed(354967)                     # Create example data frame
data <- data.frame(x = rnorm(100),
                   y = rnorm(100),
                   group = rep(LETTERS[1:4], each = 25))
head(data)                           # Head of example data frame

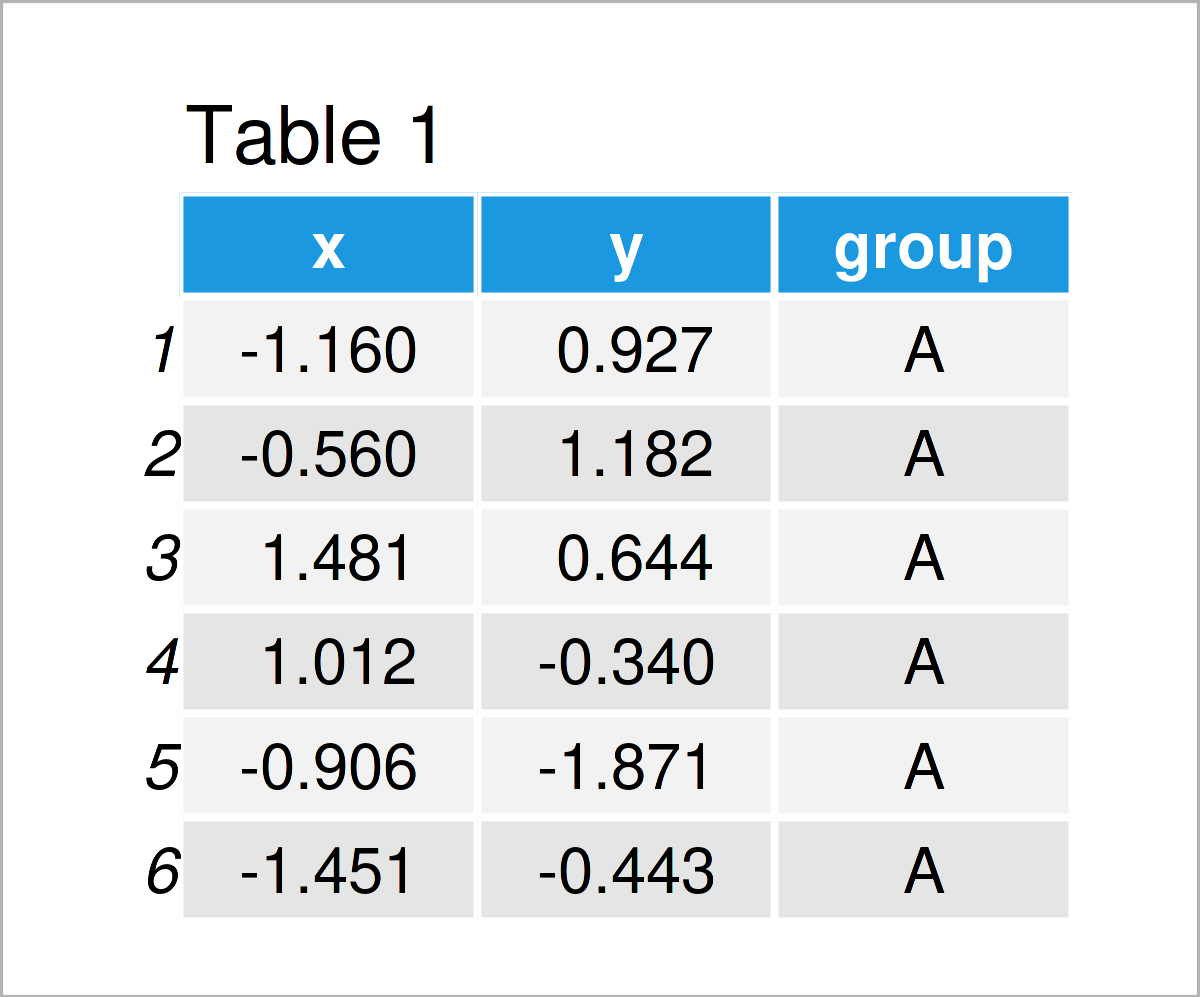
As you can see based on Table 1, the exemplifying data is a data frame consisting of three columns called “x”, “y”, and “group”. The variables x and y have the numeric data class and the variable group is a character.
Note that our data is in long format. In case your data is in wide format, you may transform it to long format first.
For the following R syntax, we also have to install and load the ggplot2 package:
install.packages("ggplot2")          # Install & load ggplot2
library("ggplot2")
Now, we can draw the data as follows:
ggplot(data,                         # Draw ggplot2 boxplot by group
       aes(x = x,
           y = y,
           fill = group)) +
  geom_boxplot()

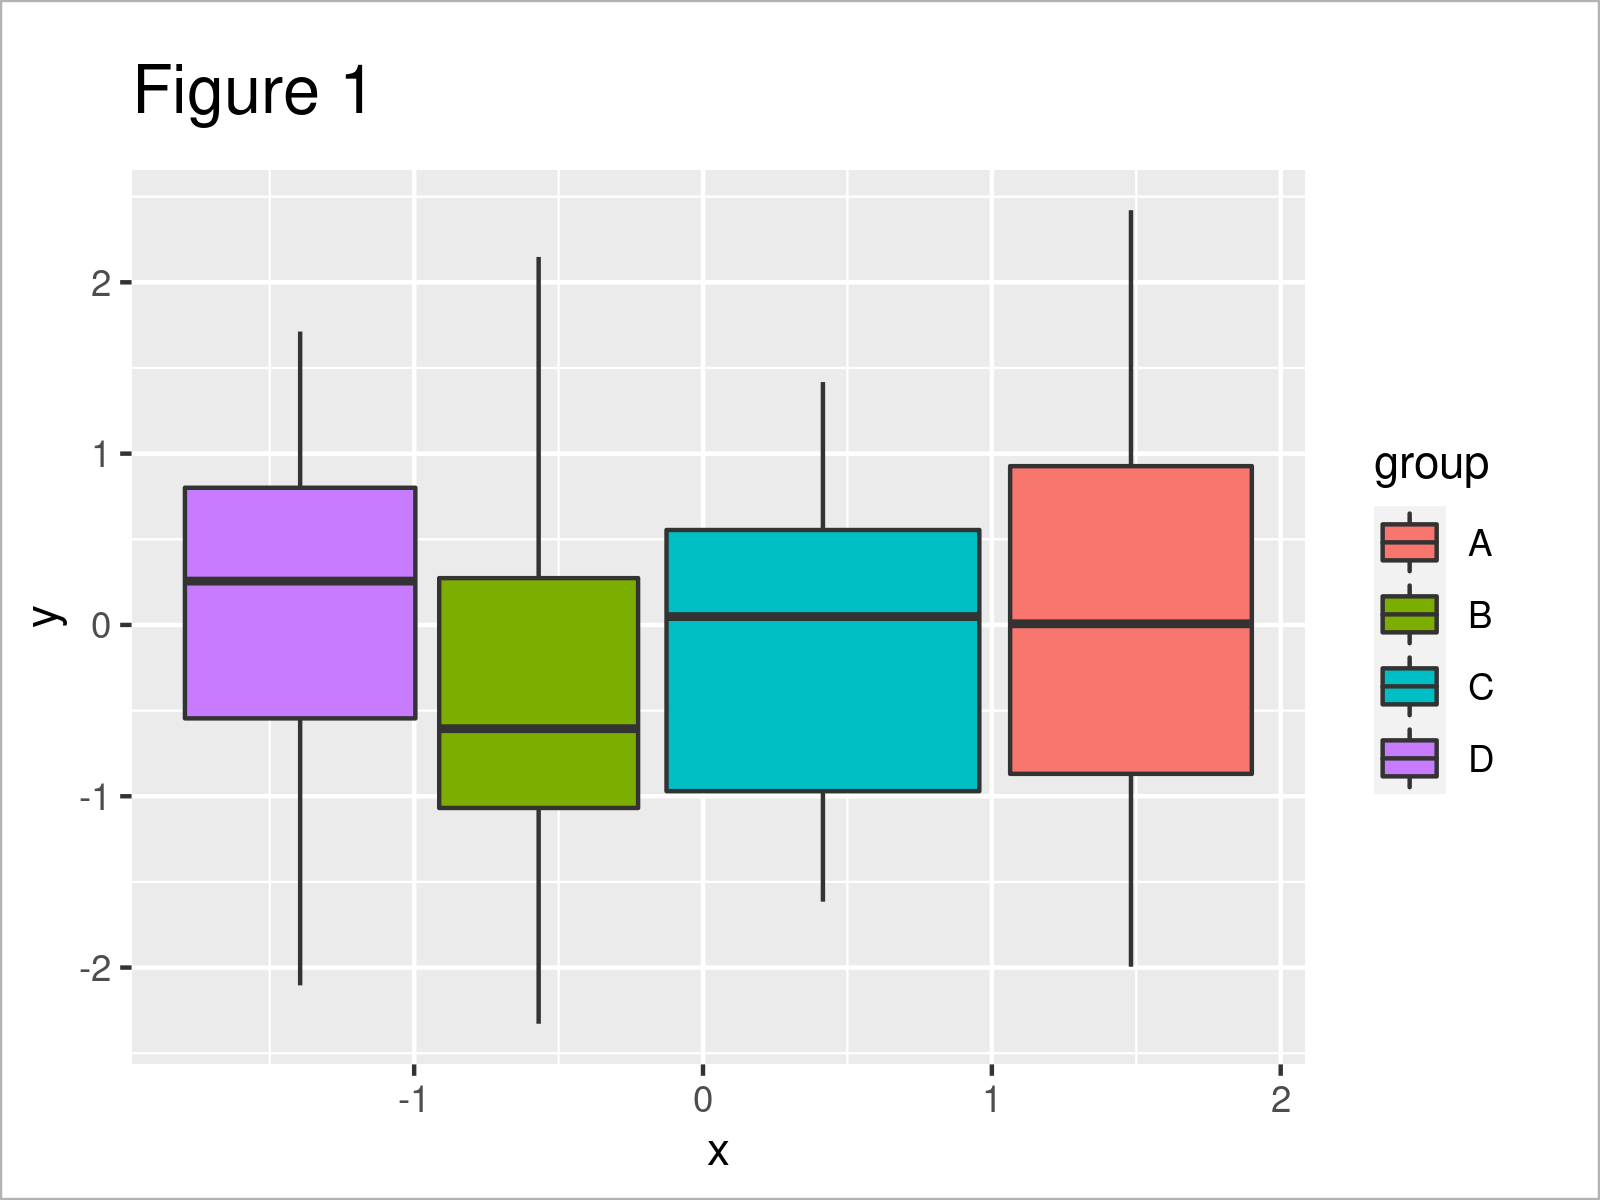
The output of the previous R programming code is shown in Figure 1 – We have created a ggplot2 boxplot containing a separate box for each of our four groups.
Example: Split Continuous x-Variable into Boxplot Groups
The following R syntax shows how to separate a continuous x-variable in each box of a boxplot into multiple subgroups.
To split the continuous x-variable, we can use the cut_width function of the ggplot2 package.
Furthermore, we can assign each main group to its own facet using the facet_grid function. This helps to differentiate between the main groups.
Consider the following R code:
ggplot(data,                         # Draw facet_grid boxplot by split groups
       aes(x = cut_width(x, width = 0.5),
           y = y,
           fill = group)) +
  geom_boxplot() +
  facet_grid(. ~ group)

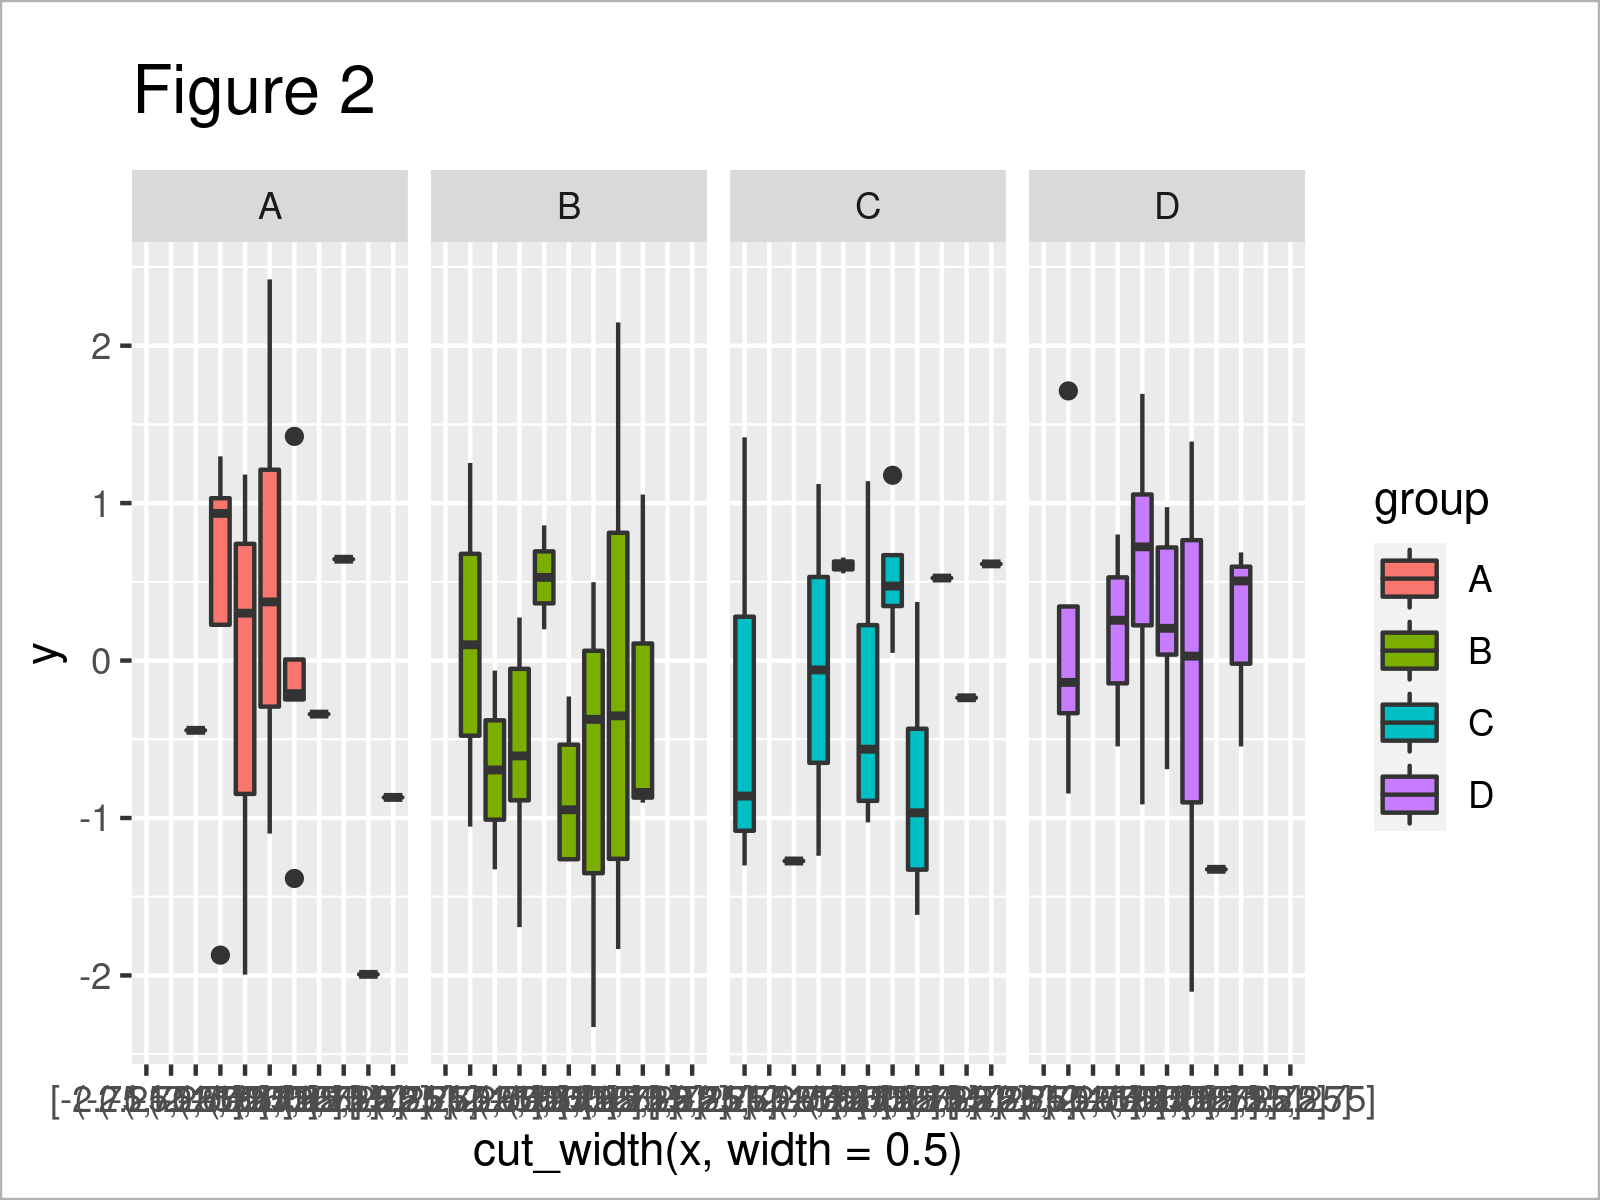
After executing the previous R syntax the ggplot2 boxplot with four facets and several subgroups within each facet shown in Figure 2 has been plotted.
Note that the x-axis labels of this plot are a bit messed up. You may change that according to your needs using the scale_x_discrete function.
Video & Further Resources
I have recently released a video on the Statistics Globe YouTube channel, which demonstrates the examples of this page. You can find the video below:
In addition, you could have a look at the other tutorials on my homepage:
- Change Color of ggplot2 Boxplot in R
- Overlay ggplot2 Boxplot with Line in R
- Graphics Overview in R
- R Programming Examples
You have learned in this post how to divide a continuous variable into boxplot-groups in R programming. Please let me know in the comments below, if you have additional questions.


