Export Plot to File Using grid.arrange Function in R (2 Examples)
In this tutorial you’ll learn how to save a grid of plots created with the grid.arrange function to an external file in the R programming language.
The article is structured as follows:
Let’s dig in!
Example Data, Packages & Default Graph
We’ll use the data below as basement for this R programming tutorial:
set.seed(56021)                                       # Create three example data frames
data1 <- data.frame(x1 = rnorm(10),
                    x2 = rnorm(10))
data2 <- data.frame(x1 = rnorm(100),
                    x2 = rnorm(100))
data3 <- data.frame(x1 = rnorm(1000),
                    x2 = rnorm(1000))
To be able to use to draw these data in ggplot2 plots, we also have to install and load the ggplot2 package:
install.packages("ggplot2")                           # Install ggplot2 package
library("ggplot2")                                    # Load ggplot2 package
Now, we can create plots of our data as shown below:
ggp1 <- ggplot(data1, aes(x1, x2)) +                  # Create three ggplot2 plots
  geom_point()
ggp2 <- ggplot(data2, aes(x1, x2)) +
  geom_point()
ggp3 <- ggplot(data3, aes(x1, x2)) +
  geom_point()
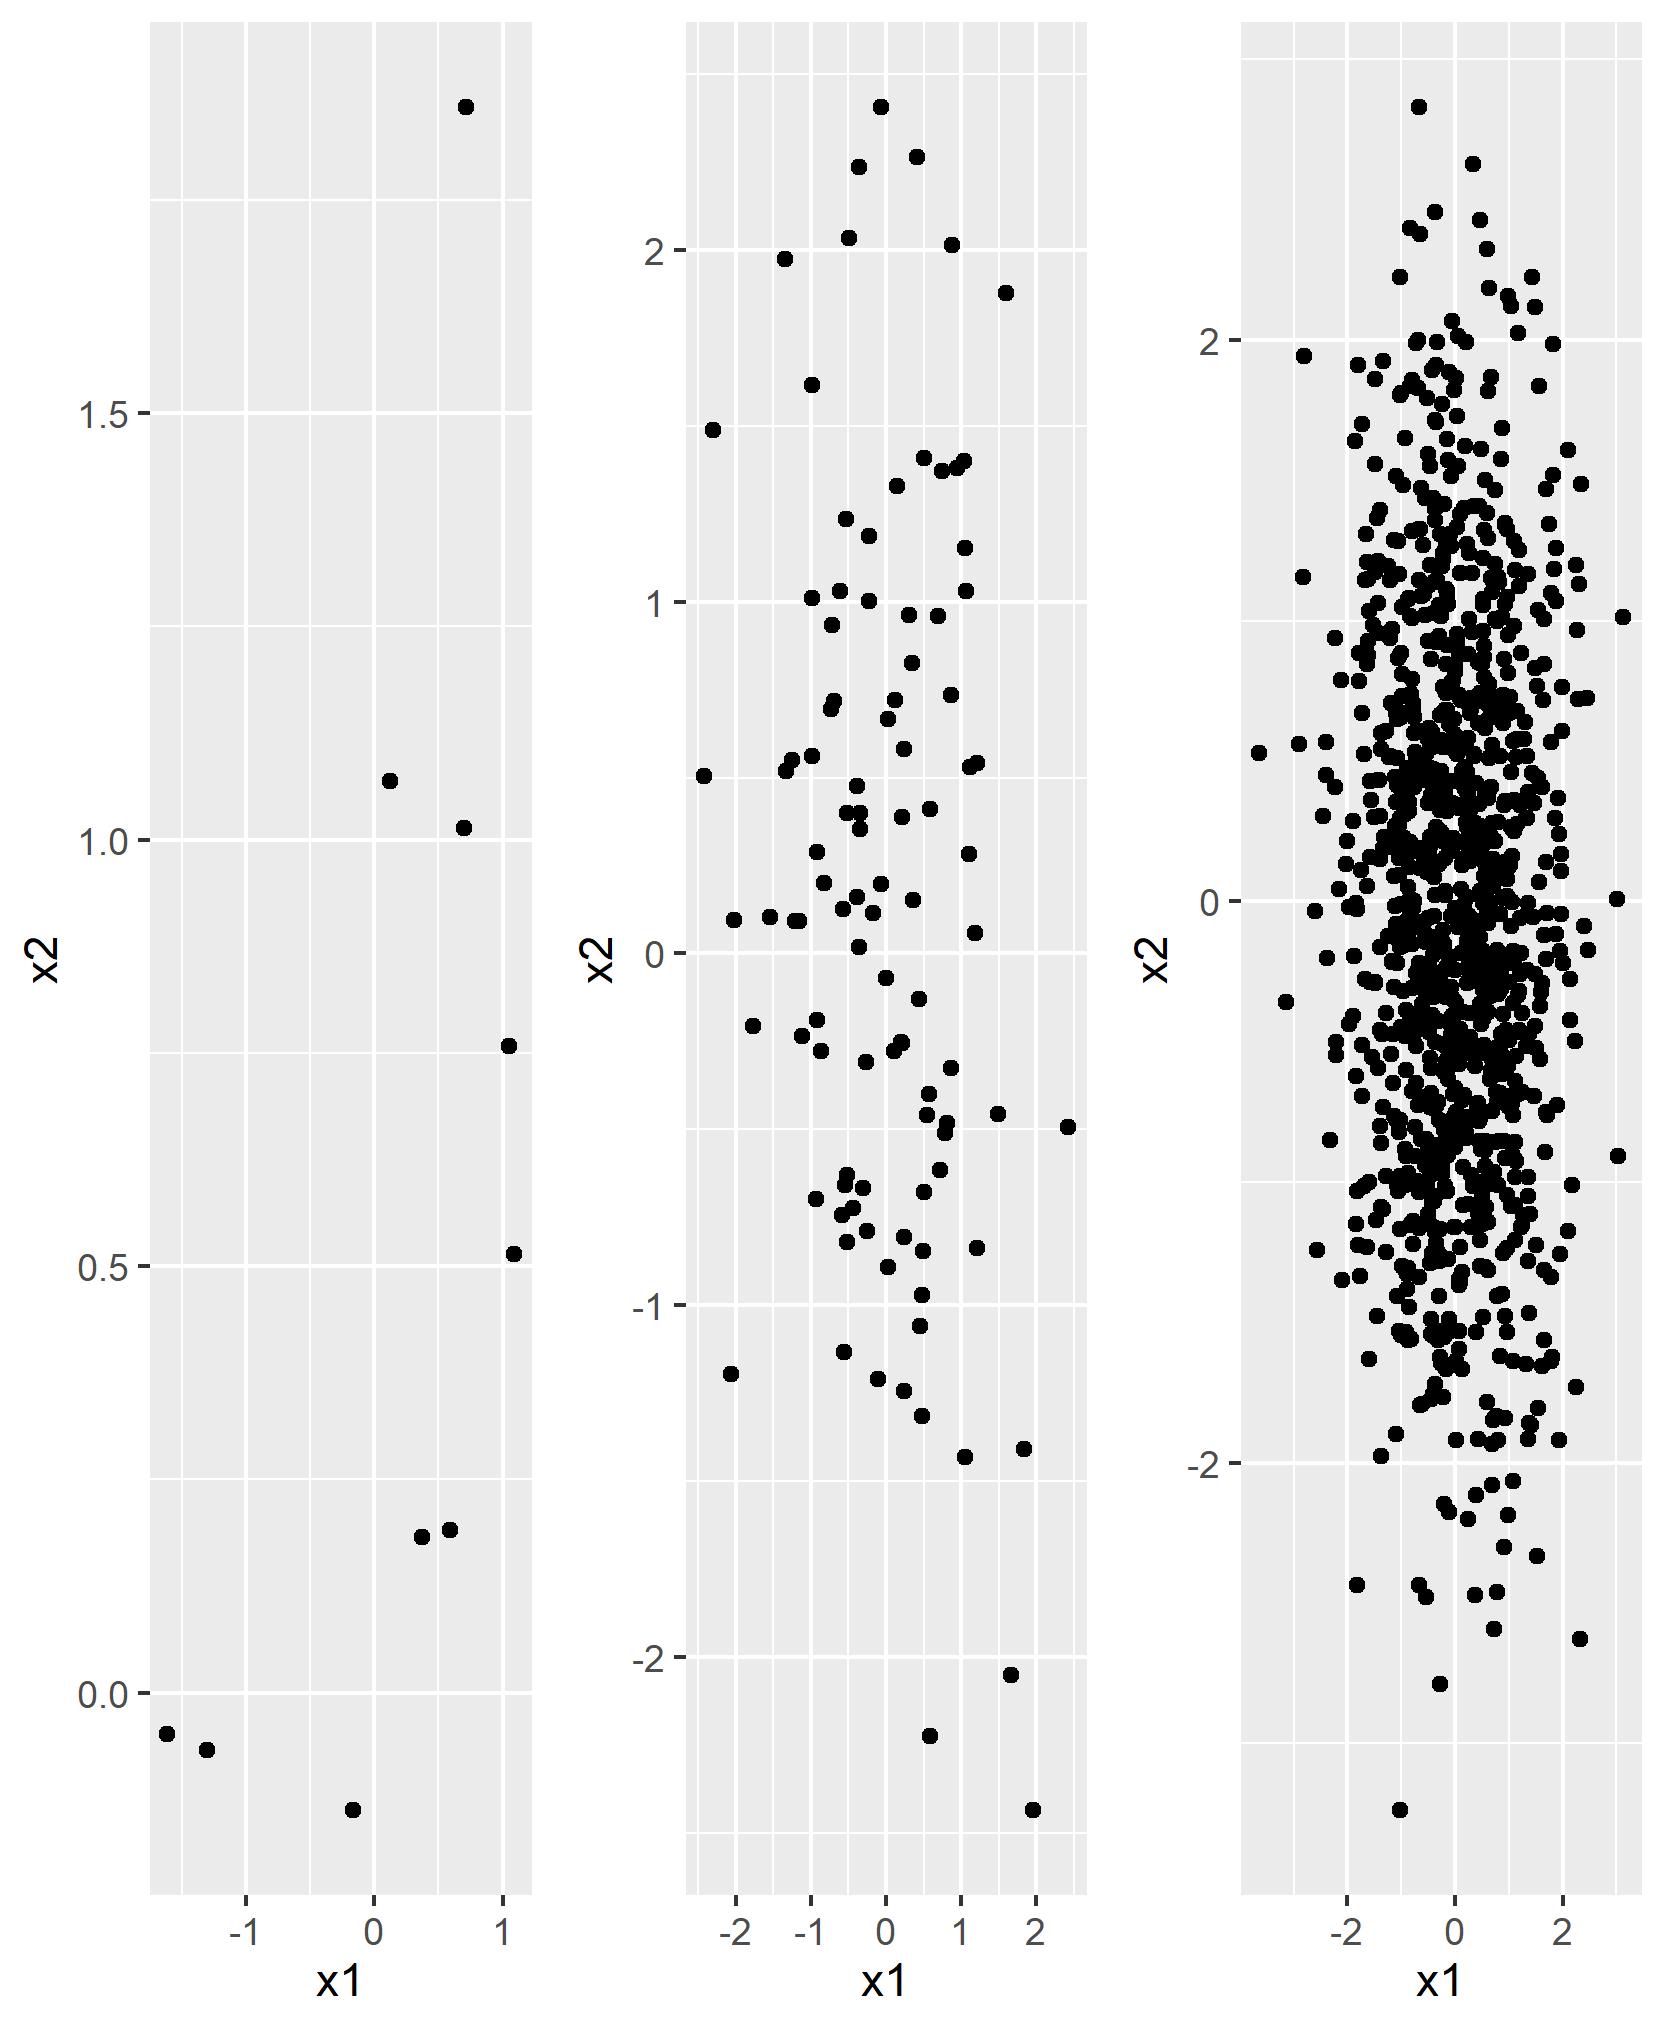
The previous R code has created three plot objects (i.e. ggp1, ggp2, and ggp3) that each contain a different ggplot2 scatterplot.
Example 1: Reproduce the problem that grid.arrange Exports Only One Plot
The following code explains how you should NOT try to export a grid of plots using the grid.arrange function.
We can draw our grid of plots within RStudio as shown below:
grid.arrange(ggp1, ggp2, ggp3, ncol = 3) # Try to export grid of plots

Next, we might try to export this plot arrangement using the ggsave function:
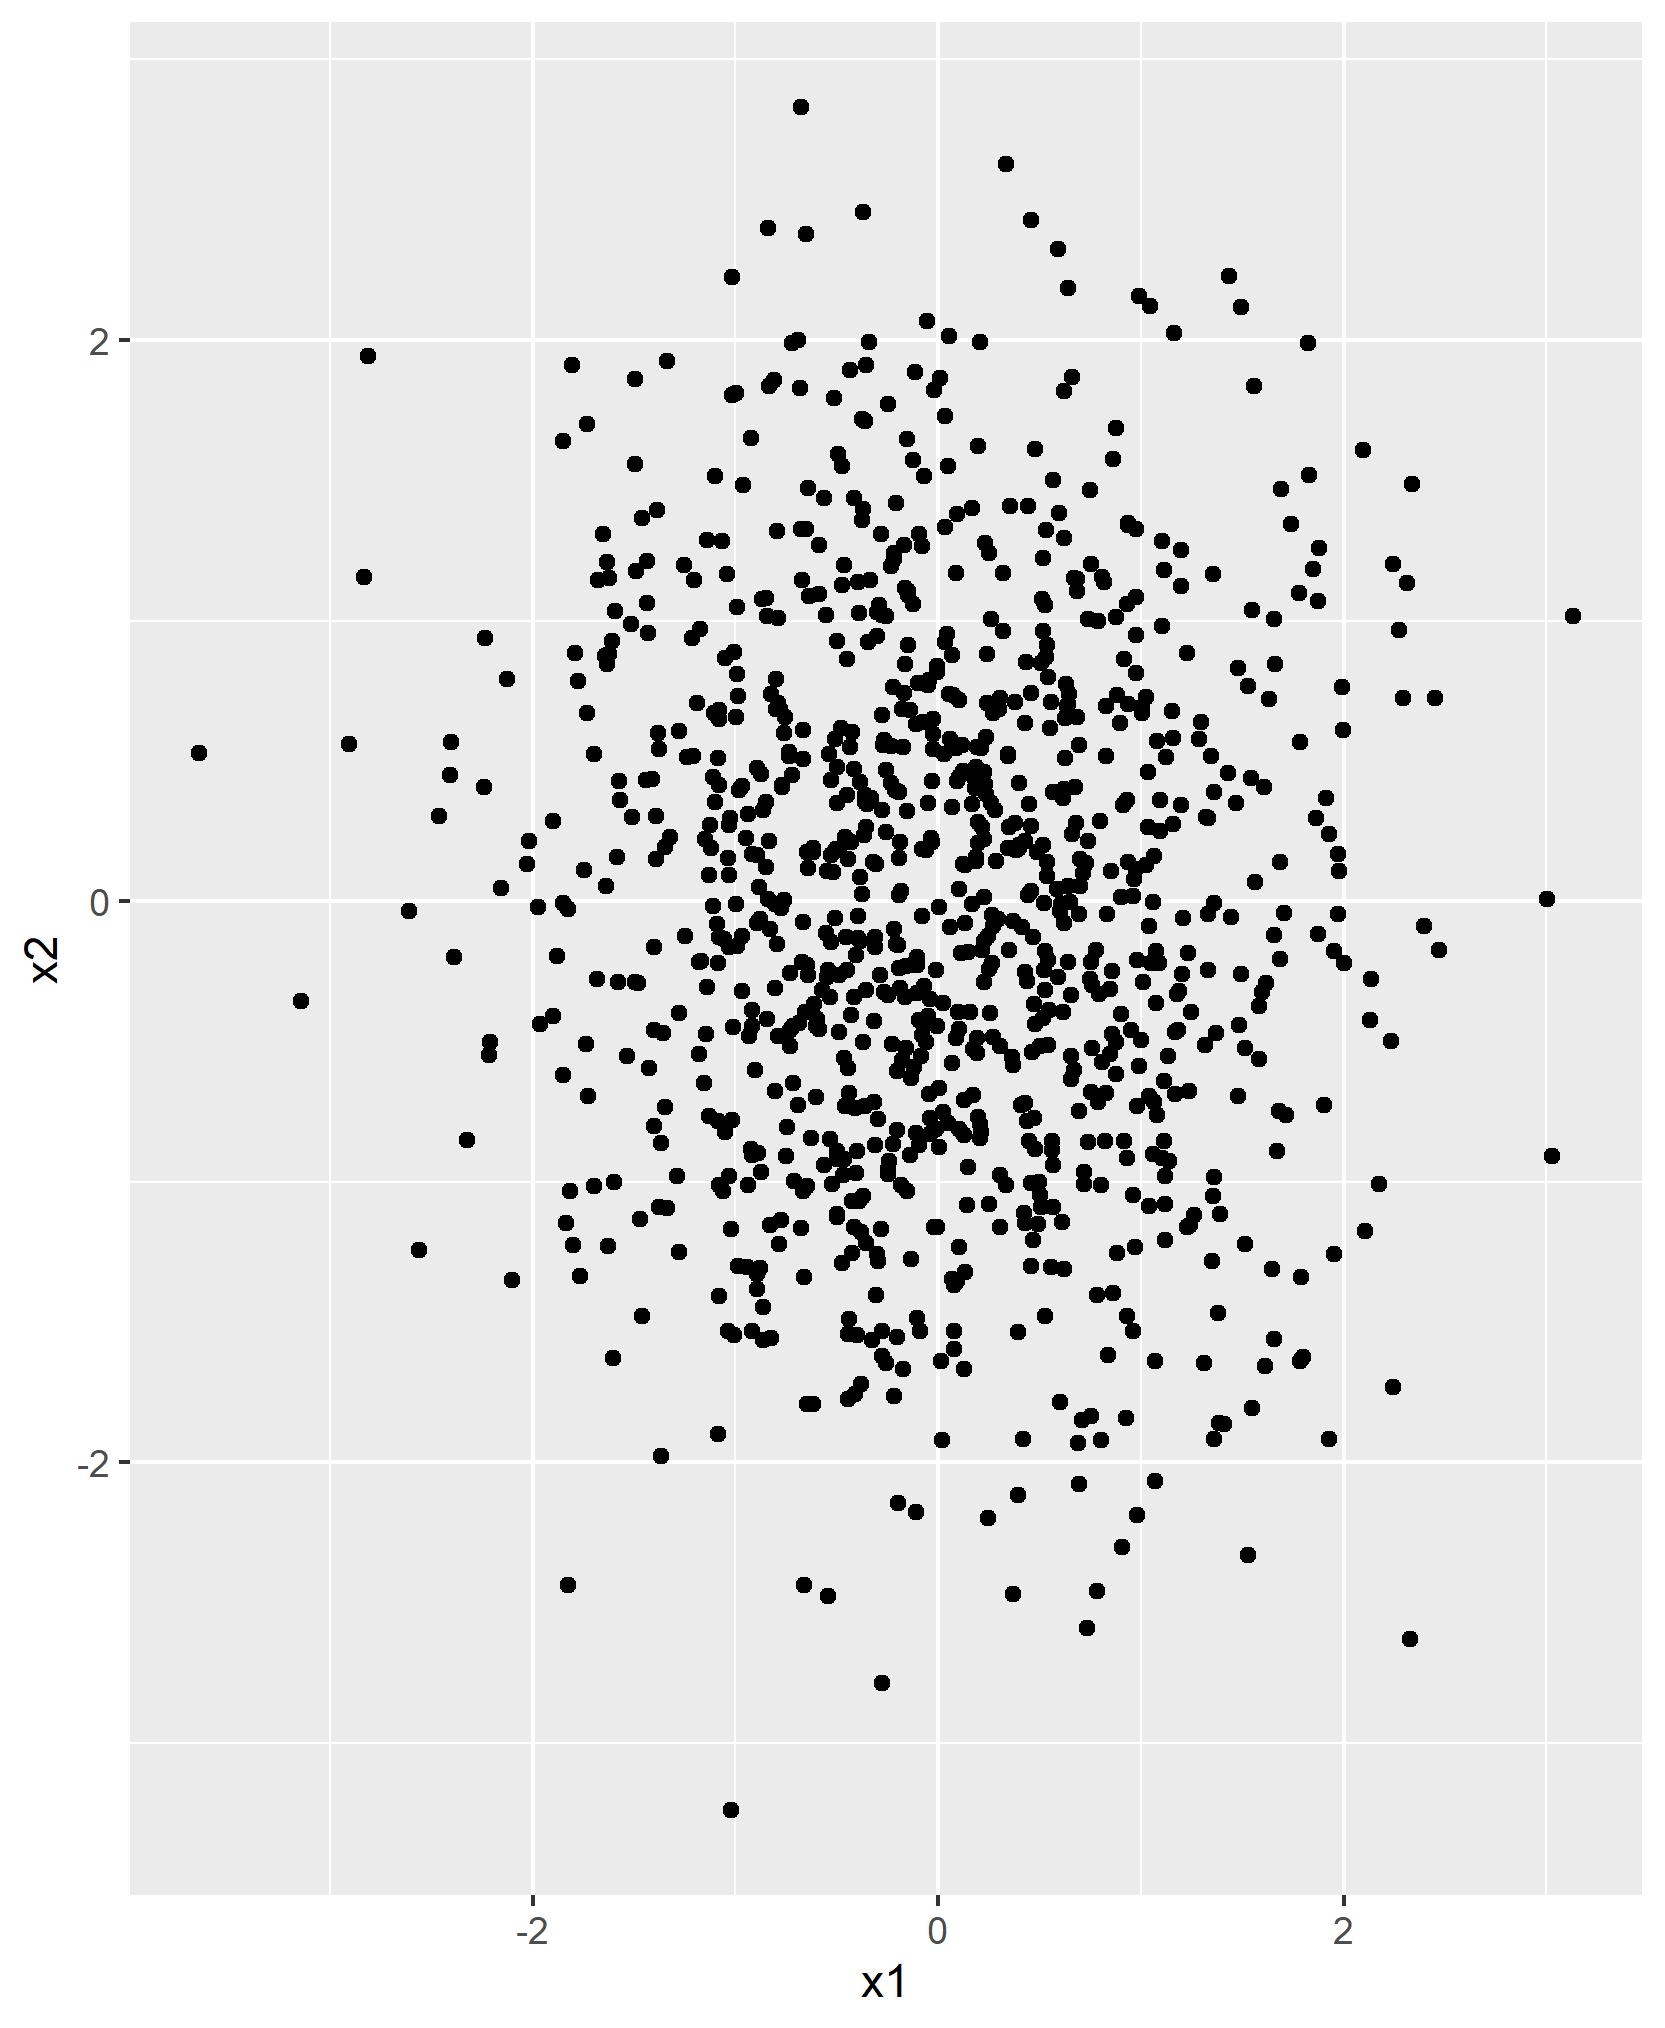
ggsave("my_grid1.jpg") # ggsave returns only one plot
Unfortunately, the previous R code saves only the last plot to a file (i.e. ggp3) – not the grid of plots that we have created before:

So how can we solve this problem? Keep on reading!
Example 2: Export Grid of Plots Using grid.arrange() & ggsave() Functions
Example 2 illustrates how to properly export a grid of ggplot2 graphics using the grid.arrange function.
For this, we first have to store our grid arrangement in a data object:
my_grid2 <- grid.arrange(ggp1, ggp2, ggp3, ncol = 3) # Save grid of plots in object
Next, we can save the grid that we have stored in a data object using ggsave:
ggsave("my_grid2.jpg", my_grid2) # ggsave returns grid of plots
Have a look at your current working directory. It should contain a PDF file containing the grid of graphs that we have created before.
Video, Further Resources & Summary
If you need more explanations on the R programming code of this tutorial, you may want to watch the following video of my YouTube channel. In the video, I’m explaining the content of this tutorial.
Furthermore, you may want to read the other articles on my website. Please find some articles about exporting graphics below.
- layout Function in R
- sink Function in R
- Export Plot to EPS File
- Graphics in R
- All R Programming Examples
To summarize: At this point you should have learned how to export a grid.arrange graphic in the R programming language. If you have additional questions and/or comments, don’t hesitate to tell me about it in the comments below.


