Draw ggplot2 Legend at the Bottom & with Two Rows in R (Example)
In this R tutorial you’ll learn how to move a ggplot2 legend with multiple rows to the bottom of a plot.
The article will consist of the following content:
Let’s just jump right in…
Example Data, Packages & Default Graphic
In the first place, we’ll have to define some example data:
data <- data.frame(x = 1:5,                        # Creating example data frame
                   y = 1:5,
                   group = LETTERS[1:5])
data                                               # Printing example data frame
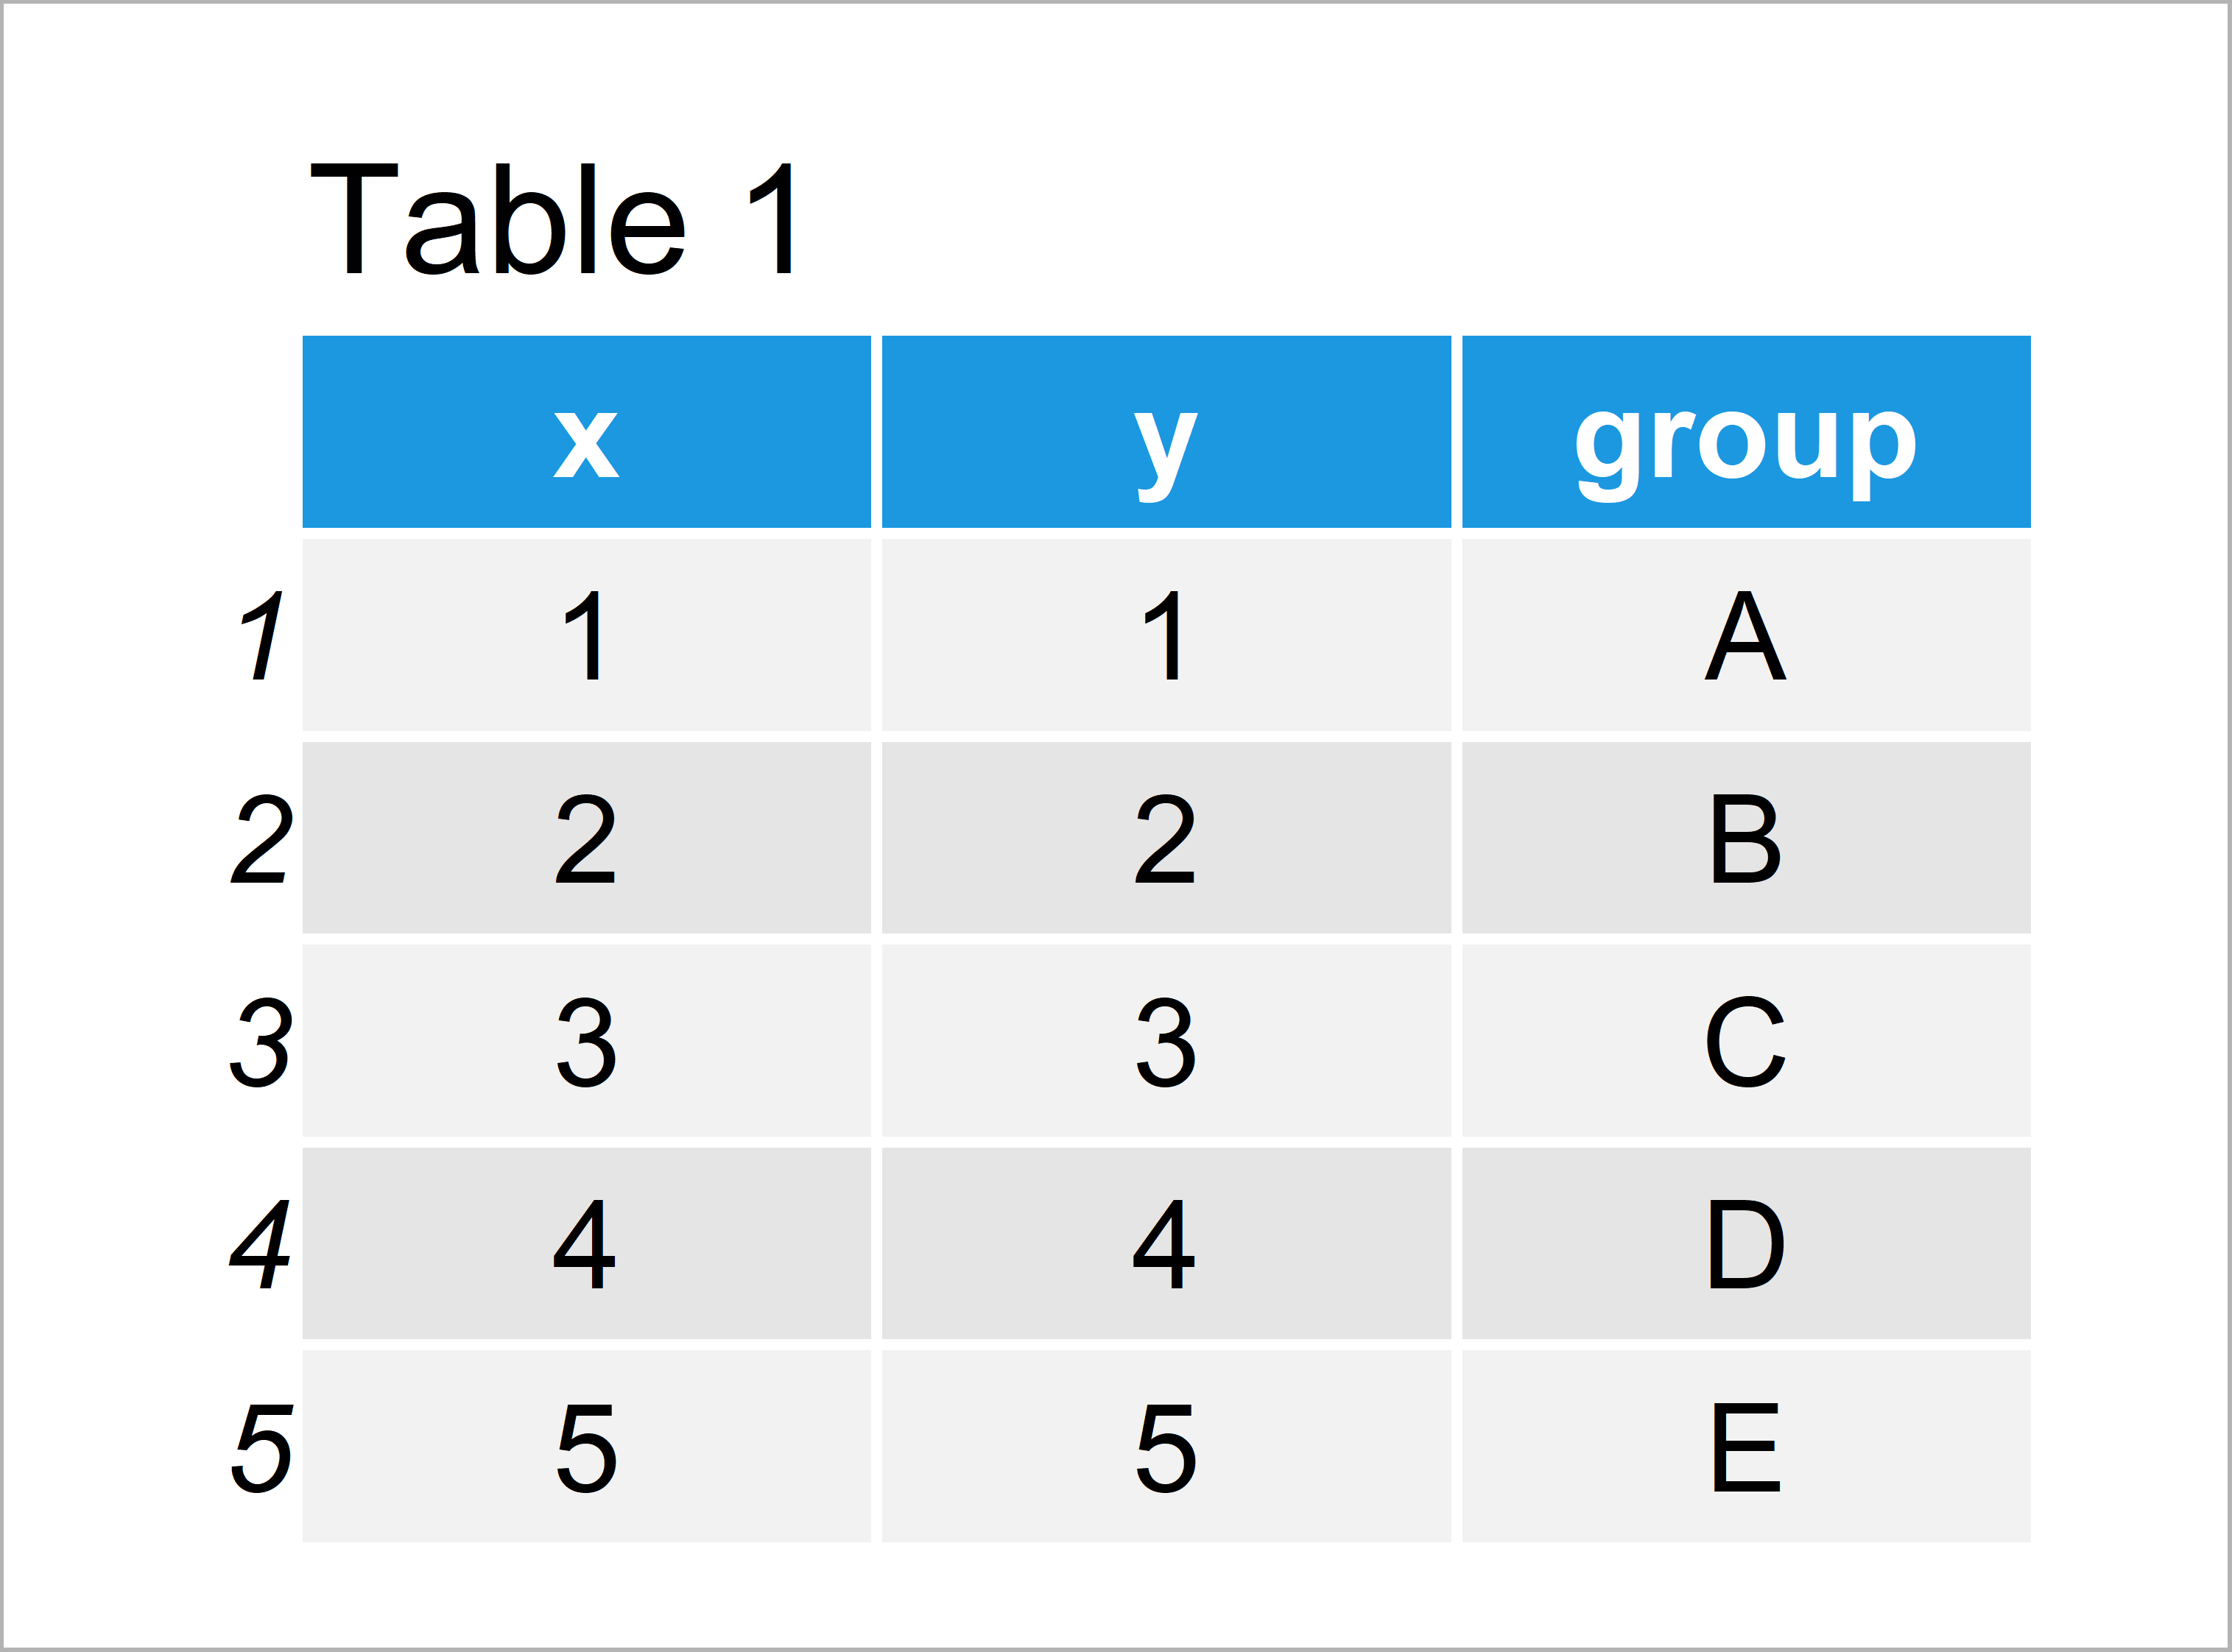
Table 1 shows that the example data consists of five rows and three columns.
We also have to install and load the ggplot2 package, to be able to use the functions that are included in the package:
install.packages("ggplot2")                        # Install & load ggplot2
library("ggplot2")
As next step, we can plot our data in a ggplot2 plot with default legend:
ggp <- ggplot(data, aes(x, y, color = group)) +    # Creating default ggplot2 plot
  geom_point()
ggp                                                # Drawing default ggplot2 plot
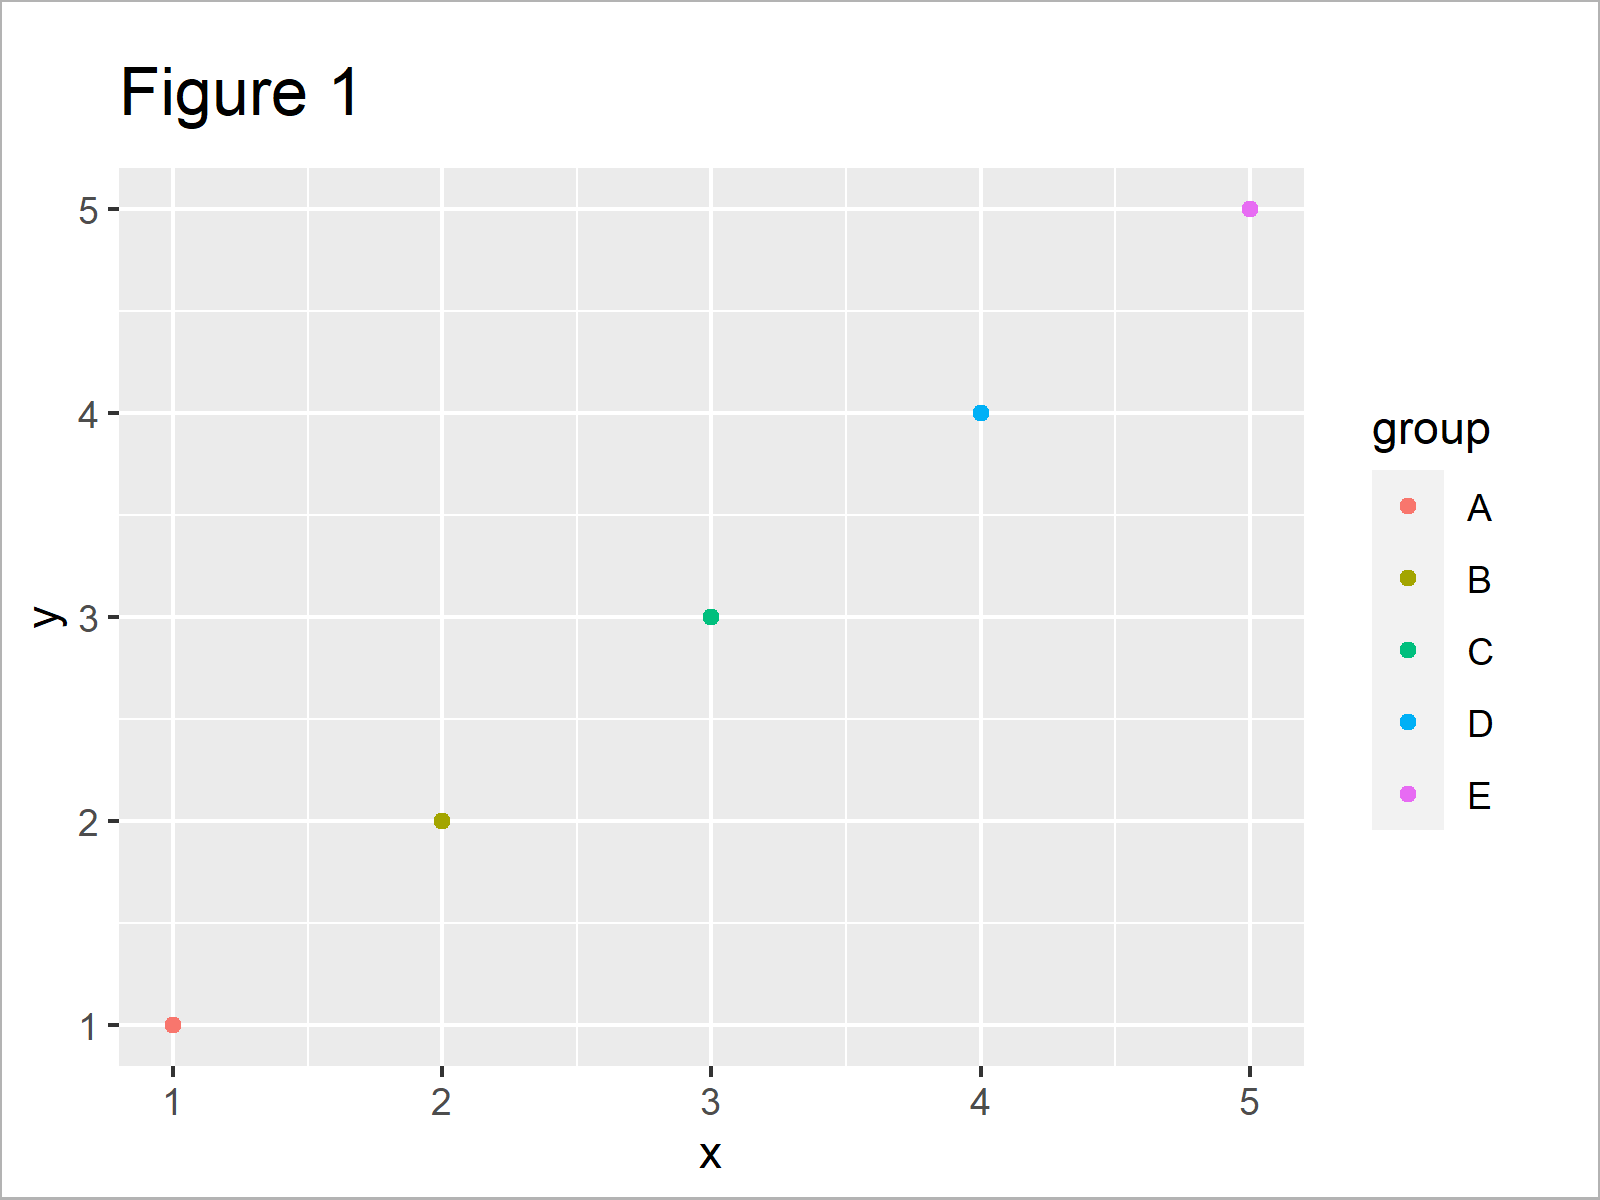
In Figure 1 you can see that we have created a ggplot2 graphic with default legend positioning on the right side of the plot.
Example: Move ggplot2 Legend to the Bottom with Two Rows
In this section, I’ll demonstrate how to create a ggplot2 legend at the bottom with multiple rows.
Let’s first use the theme function to move our legend to the bottom:
ggp +                                              # Moving ggplot2 legend to the bottom
  theme(legend.position = "bottom")
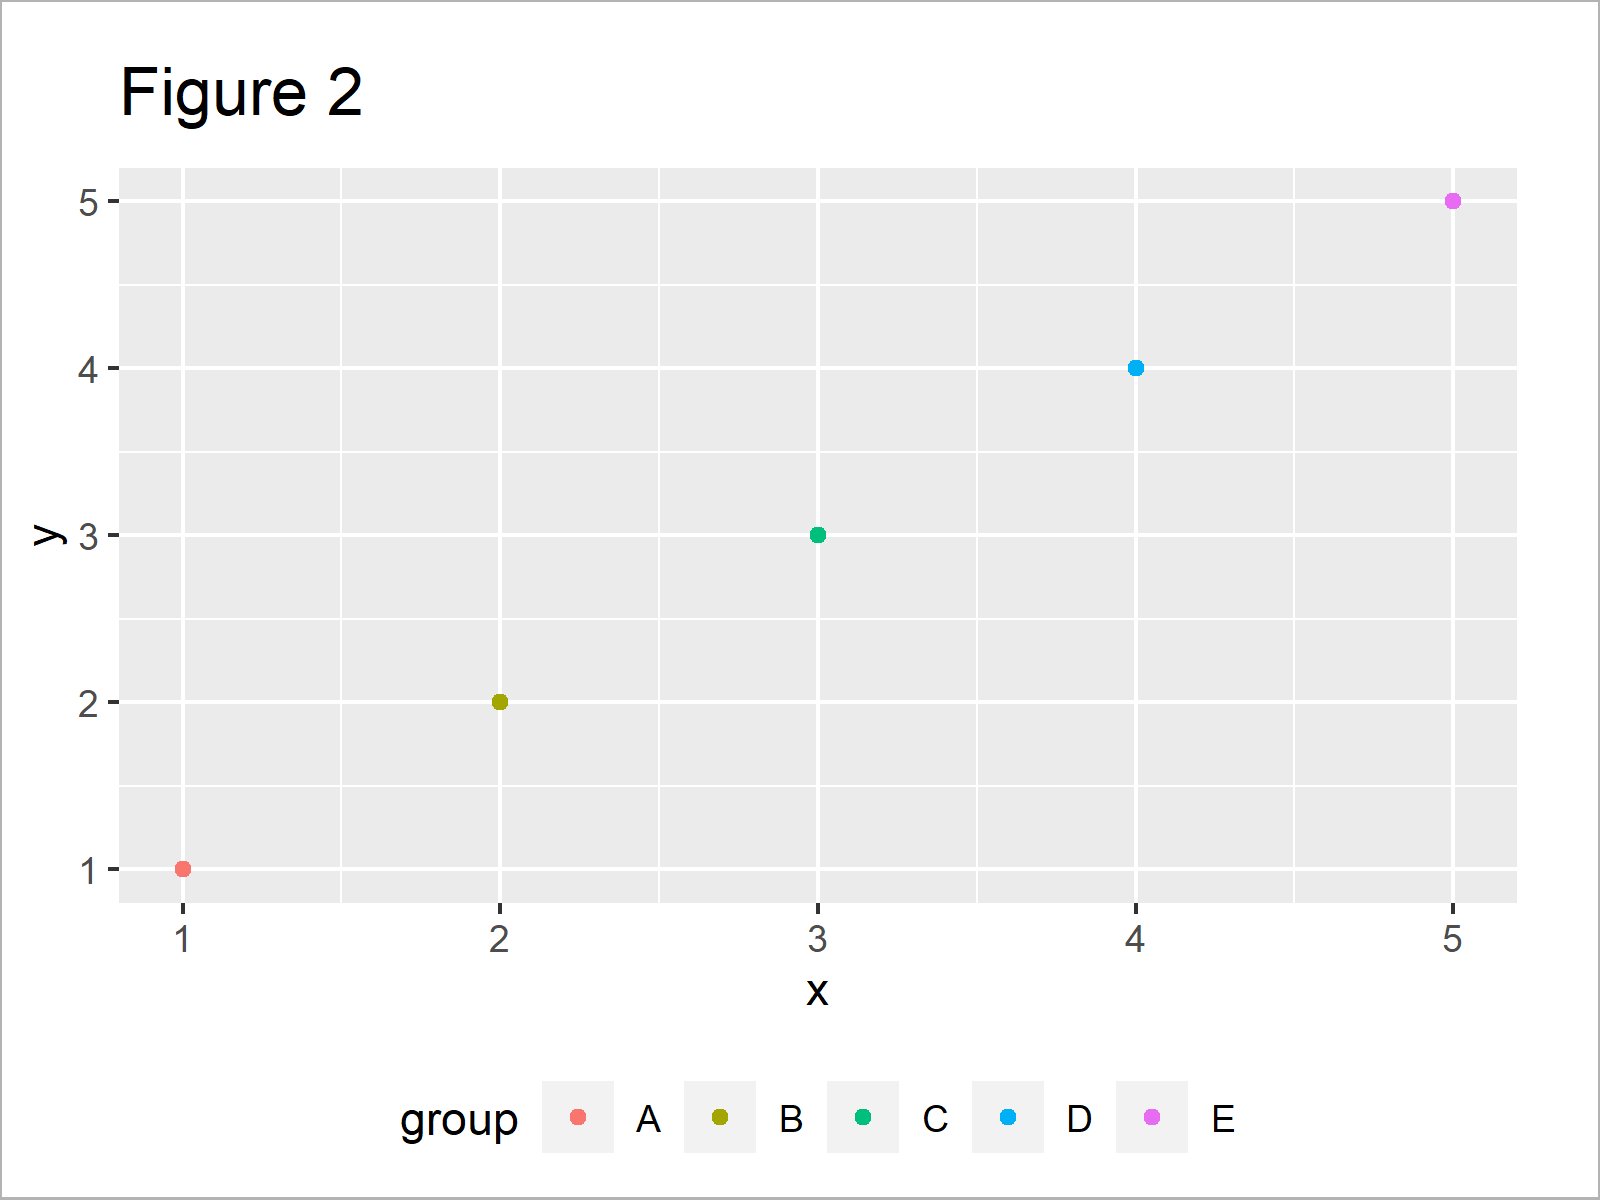
By executing the previous R programming code we have created Figure 2, i.e. a ggplot2 graphic with a horizontally aligned legend below the plot.
If we want to draw a legend with multiple lines below our plot, we have to use the guides and guide_legend functions in addition to the theme function:
ggp +                                              # Specifying number of legend rows
  theme(legend.position = "bottom") +
  guides(color = guide_legend(nrow = 2, byrow = TRUE))
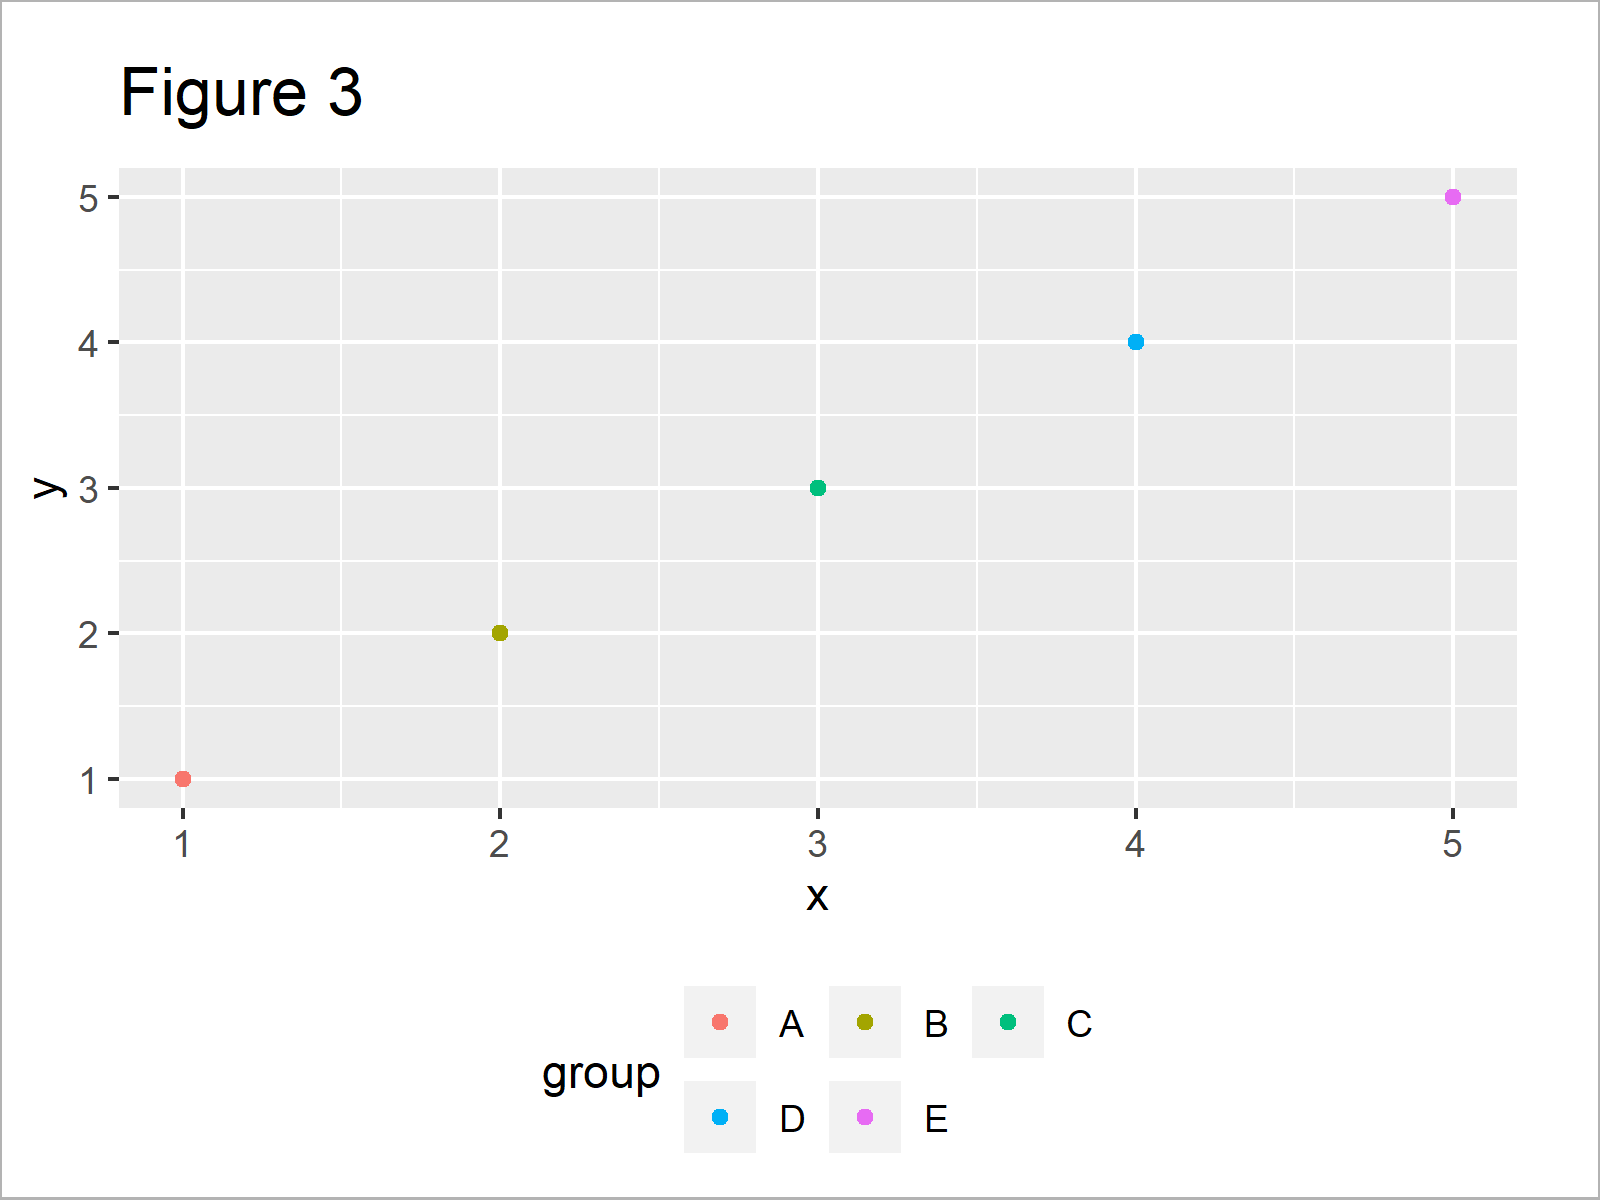
Figure 3 shows the output of the previously shown R syntax: A ggplot2 plot with a legend at the bottom of the plot and with multiple lines.
Note that we have used the byrow argument within the guide_legend function to order our legend by rows instead of by columns.
Video, Further Resources & Summary
Have a look at the following video of my YouTube channel. In the video instruction, I’m demonstrating the content of this article:
In addition, you could have a look at the related tutorials of statisticsglobe.com. A selection of tutorials about ggplot2 plots can be found below.
- Draw ggplot2 Legend without Plot in R
- Draw ggplot2 Plot with Two Y-Axes in R
- Show ggplot2 Legend at the Bottom of a Plot & Horizontally Aligned
- Plots in R
- R Programming Overview
In summary: You have learned in this tutorial how to create a ggplot2 graph legend with multiple rows wrapped at the bottom of a plot in the R programming language. Let me know in the comments, if you have additional questions.



2 Comments. Leave new
Hello Schork,
Many thanks for your tutorials and videos which save us from many situations and are a reference for us. I enjoy learning from each of your publications.
I wanted to ask you if it was possible to make a post about the graphs of the correlation metrics, especially the graphs that show in a corner the values of RMSE, R2 and other deviation indicators: SCR, MSE, MAE and MAPE?
Thanks
Hey Tito,
Thank you so much for the kind words, glad you find my tutorials helpful! 🙂
Also, thanks for the topic requests, I’ll note them on my to-do list.
Regards,
Joachim