Count Positive & Negative Elements in Vector & Data Frame in R (3 Examples)
Sometimes we need to count positive and negative elements in a vector or in a data frame. How can this be done using R programming language? In this article you’ll learn how to do this.
The table of content has the following structure:
Let’s take a look at the examples below.
Example Data
For this tutorial, we will need to create some example data. We will need a vector:
set.seed(999)
vector1 <- rnorm(30)
vector1
 # [1] -0.28174016 -1.31255963  0.79518398  0.27007049 -0.27730642
 # [6] -0.56602374 -1.87865826 -1.26679114 -0.96774968 -1.12100936
# [11]  1.32546371  0.13397739  0.93874945  0.17253810  0.95765045
# [16] -1.36268625  0.06833513  0.10065765  0.90134475 -2.07435711
# [21] -1.22856330  0.64304432 -0.35976291  0.29403559 -1.12526849
# [26]  0.64226565 -1.10673758 -0.88484039 -1.55409514 -0.12667899
And a dataset:
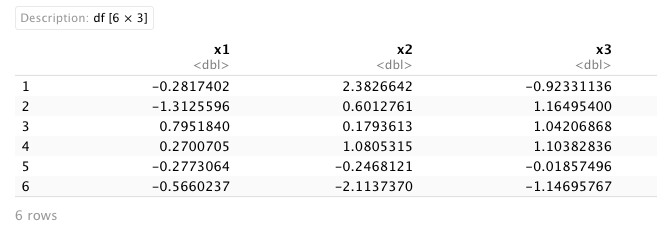
set.seed(999)
data_sample <- data.frame(x1 = rnorm(30),
                          x2 = rnorm(30),
                          x3 = rnorm(30))
head(data_sample)
Example 1: Count Positive and Negative Elements in Vector Using length() Function
An easy way to count positive and negative elements in a vector is using the length() function.
Considering our example vector, if we now want to count positive and negative elements in this vector, we can use the length() function as shown below:
length(vector1[vector1>0]) # count positive elements
# [1] 13
length(vector1[vector1<0]) # count negative elements
# [1] 17
As we can see, in our vector, there are 13 positive values and 17 negative values.
Example 2: Count Positive and Negative Elements in Data Frame Column Using table() Function
We can count the positive and negative elements in a data frame column by using the table() function.
Considering our example data frame, if we want to count positive and negative elements by column, we can use the table() function:
table(sign(data_sample$x1))
# -1  1
# 17 13
table(sign(data_sample$x2))
# -1  1
# 14 16
table(sign(data_sample$x3))
# -1  1
# 16 14
In our output, the number of -1 results correspond to the negative elements, and the 1 results to the positive counts for each column.
Example 3: Count Positive and Negative Elements in Data Frame Column Using count() Function
Also, we can count the positive and negative elements in a data frame column by using the count() function from the plyr package. If you haven’t installed it yet, please install the plyr package and load it. If you had already installed it before, just skip the first step:
install.packages("plyr")
library(plyr)
Considering our example data, we can load the plyr package and use the count() function to count every positive and negative element from each column:
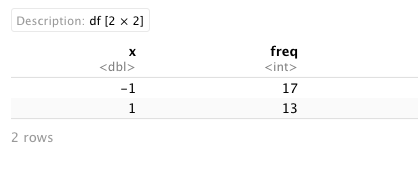
with(data_sample,count(sign(x1)))
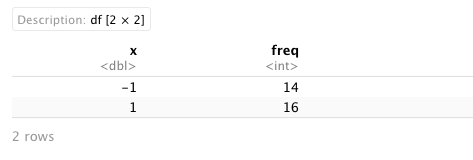
with(data_sample,count(sign(x2)))
with(data_sample,count(sign(x3)))
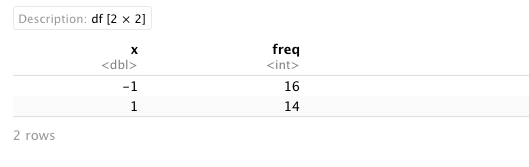
As in the previous example, the total of negative and positive values correspond to -1 and 1 respectively.
Video, Further Resources & Summary
Do you need more explanations on how to count positive and negative values in a vector and a data frame in R? Then you should have a look at the following YouTube video of the Statistics Globe YouTube channel.
The YouTube video will be added soon.
Furthermore, you could have a look at some of the other tutorials on Statistics Globe:
- Count Occurrences of Value in Data Frame in R
- Extract & Count Unique Values in Each Column of Data Frame in R
- Count Non-NA Values in R
- Replicate Vector in Matrix in R
This post shows how to get the number of positive and negative numbers in a vector and a data frame variable in R. In case you have further questions, you may leave a comment below.

This page was created in collaboration with Paula Villasante Soriano. Please have a look at Paula’s author page to get more information about her academic background and the other articles she has written for Statistics Globe.

I’m Joachim Schork. On this website, I provide statistics tutorials as well as code in Python and R programming.
Statistics Globe Newsletter
Get regular updates on the latest tutorials, offers & news at Statistics Globe. I hate spam & you may opt out anytime: Privacy Policy.