Calculate Mean in Python (5 Examples)
In this tutorial, I’ll demonstrate how to compute the mean of a list and the columns of a pandas DataFrame in Python programming.
The content of the article is structured as follows:
If you want to learn more about these contents, keep reading:
Example 1: Mean of List Object
This example illustrates how to get the average of the values in a list object.
For this example, we first have to create an example list:
my_list = [1, 4, 6, 1, 3, 1, 4, 5]                      # Create example list
print(my_list)                                          # Print example list
# [1, 4, 6, 1, 3, 1, 4, 5]
Furthermore, we have to import the NumPy library:
import numpy as np # Load NumPy
Now, we can apply the mean function provided by the NumPy library to our example list as shown below:
print(np.mean(my_list))                                 # Get mean of list
# 3.125
The previous console output shows our final result, i.e. the mean of our list is 3.125.
Example 2: Mean of One Particular Column in pandas DataFrame
The Python syntax below explains how to compute the mean of a specific column in a pandas DataFrame.
As a first step, we have to import the pandas library:
import pandas as pd # Import pandas library in Python
Next, we also have to create an exemplifying pandas DataFrame:
data = pd.DataFrame({'x1':[6, 2, 7, 5, 3, 7, 2, 7, 9],  # Create pandas DataFrame
                     'x2':range(0, 9),
                     'group':['A', 'B', 'B', 'A', 'A', 'C', 'C', 'B', 'A']})
print(data)                                             # Print pandas DataFrame

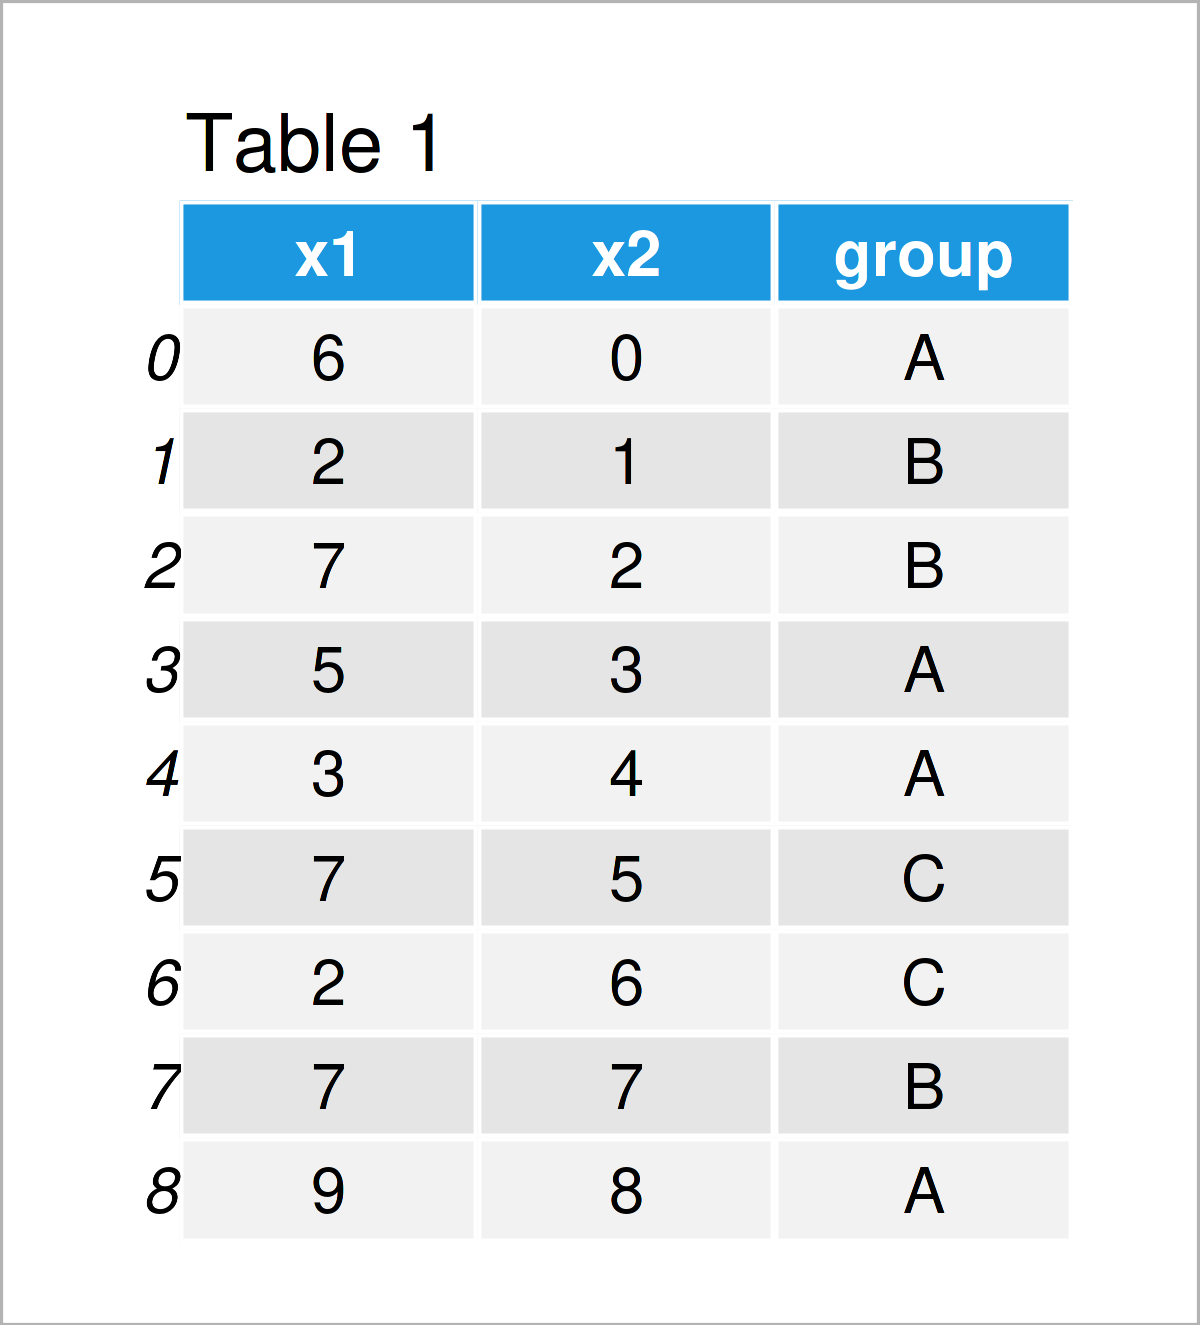
As shown in Table 1, the previous Python programming syntax has constructed a pandas DataFrame containing three columns called x1, x2, and group.
The columns x1 and x2 contain floats and the column group is a group indicator (more on that later).
Let’s assume that we want to find the average of the variable x1. Then, we can apply the following Python syntax:
print(data['x1'].mean())                                # Get mean of one column
# 5.333333333333333
As you can see, the mean of the column x1 is 5.33.
Example 3: Mean of All Columns in pandas DataFrame
We can also calculate the mean of all pandas DataFrame columns (excluding the grouping column).
For this, we simply have to apply the mean function to our entire data set:
print(data.mean())                                      # Get mean of all columns
# x1    5.333333
# x2    4.000000
# dtype: float64
Example 4: Mean of Rows in pandas DataFrame
So far, we have calculated mean values for the columns of our pandas DataFrame.
The Python syntax below illustrates how to get the mean for each row in our data set.
To achieve this, we have to specify the axis argument to be equal to 1:
print(data.mean(axis = 1))                              # Get mean of rows
# 0    3.0
# 1    1.5
# 2    4.5
# 3    4.0
# 4    3.5
# 5    6.0
# 6    4.0
# 7    7.0
# 8    8.5
# dtype: float64
Example 5: Mean by Group
Example 5 illustrates how to calculate the column means for each group in a pandas DataFrame separately.
For this task, we need to specify the groupby function in addition to the mean function as shown below:
print(data.groupby('group').mean())                     # Get mean by group
#              x1        x2
# group
# A      5.750000  3.750000
# B      5.333333  3.333333
# C      4.500000  5.500000
The previous output shows a different mean value for each column and each group of our data.
Video, Further Resources & Summary
Do you need further explanations on the Python programming code of this post? Then you might want to watch the following video on my YouTube channel. I’m illustrating the Python codes of this article in the video.
In addition, you could have a look at the other tutorials on my website.
- Introduction to the pandas Library in Python
- Calculate Mean by Group in Python
- mean() Function of NumPy Library
- mean() Function of statistics Module in Python
- Harmonic Mean in Python
- Geometric Mean in Python
- Mean of Columns & Rows of pandas DataFrame in Python
- Summary Statistics of pandas DataFrame in Python
- Python Programming Overview
At this point you should have learned how to calculate the average of a list and the columns of a pandas DataFrame in the Python programming language. Don’t hesitate to let me know in the comments, in case you have further questions.


