How to Use pandas in Python (5 Examples)
This tutorial illustrates how to apply the functions of the pandas library in Python.
Table of contents:
If you want to learn more about these content blocks, keep reading…
Import the pandas Library to Python
The very first step when we want to use the functions of the pandas library is that we have to import this library to Python.
We can do that using the Python syntax below:
import pandas as pd # Load pandas library
After running the previous Python code, we can use the functions and commands of pandas.
Let’s do this!
Create DataFrame Using pandas Library in Python
A very useful feature of the pandas library is that it enables us to create our own DataFrame objects.
For this, we can use the pd.DataFrame() function as illustrated below:
data = pd.DataFrame({"x1":["x", "x", "y", "y", "x", "y"],  # Create pandas DataFrame
                     "x2":range(24, 30),
                     "x3":["a", "b", "c", "d", "e", "f"],
                     "x4":range(11, 5, - 1)})
After executing the previous syntax, a new DataFrame object called data has been created.
We can print this DataFrame object to the Python console by applying the print function:
print(data) # Print pandas DataFrame
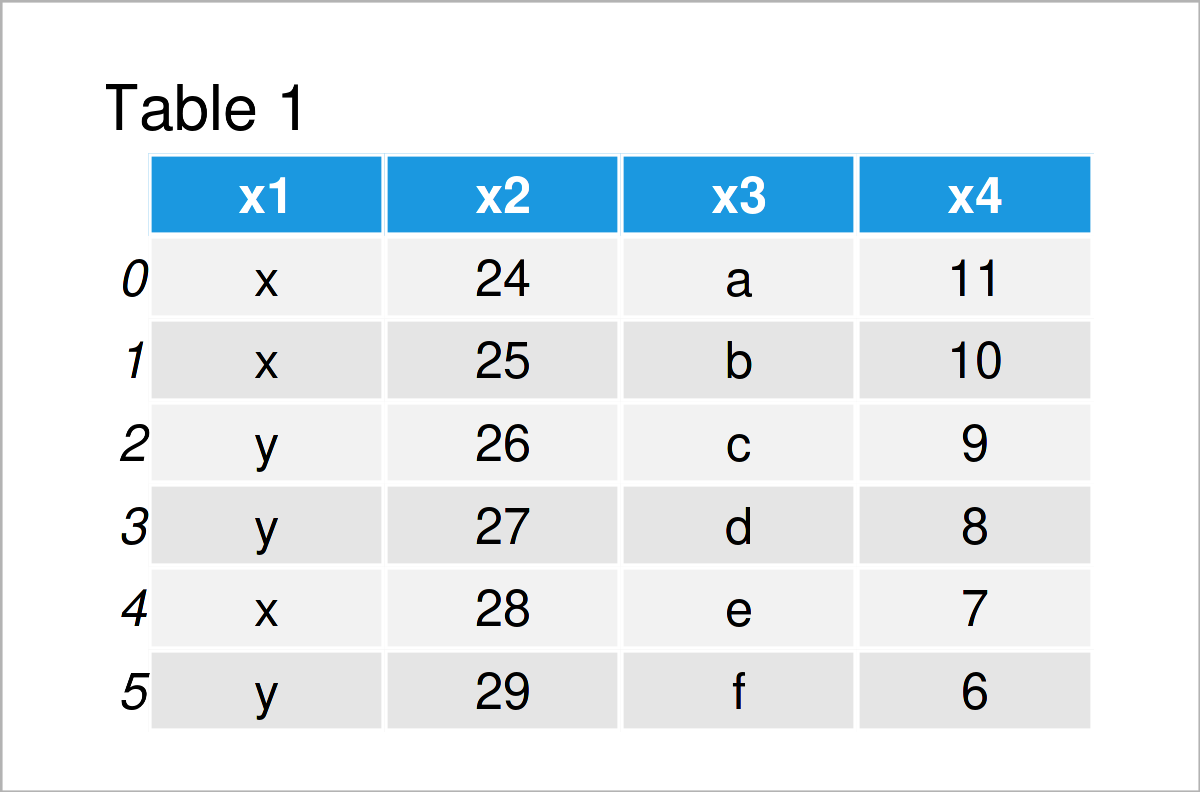
Table 1 illustrates the structure of our DataFrame – It consists of six rows and four columns.
In the following examples, we’ll use this data set as basis for several data manipulations and data analyses.
Example 1: Add New Column to pandas DataFrame
The following Python code illustrates how to append a new variable to an already existing pandas DataFrame.
As a first step, we have to create a list object that we can add later on to our DataFrame:
x5 = ["foo", "bar", "foo", "bar", "foo", "bar"]            # Create list
print(x5)                                                  # Print list
# ['foo', 'bar', 'foo', 'bar', 'foo', 'bar']
Please note that it’s important that our list has the same length as the number of rows of our pandas DataFrame.
In the next step, we can apply the assign function to add this list as a new variable to our DataFrame that we have created in the previous section.
data_new1 = data.assign(x5 = x5)                           # Add new column
print(data_new1)                                           # Print DataFrame with new column
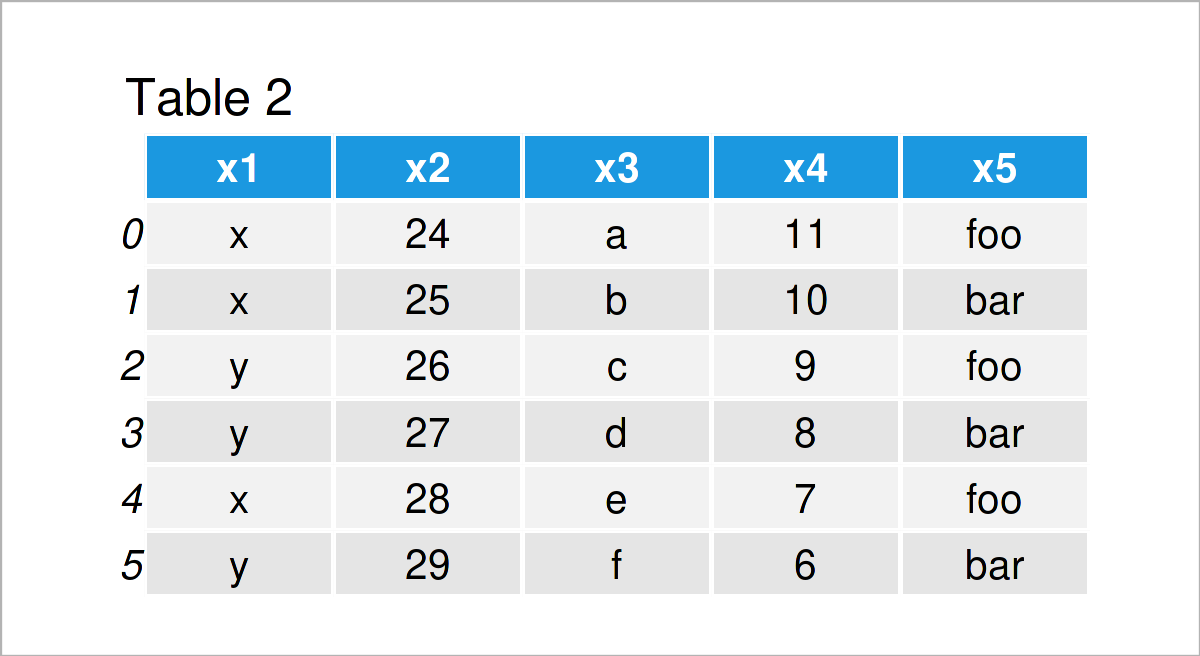
In Table 2 you can see that we have created a new DataFrame object called data_new1 that contains our DataFrame from the previous section plus the list we have created in this section as a new column called x5.
Example 2: Remove Column from pandas DataFrame
In this example, we’ll do the opposite of Example 1, i.e. we drop a particular column from a pandas DataFrame.
For this task, we can use the drop function as shown in the following code:
data_new2 = data.drop("x3", axis = 1)                      # Drop variable from DataFrame
print(data_new2)                                           # Print updated DataFrame
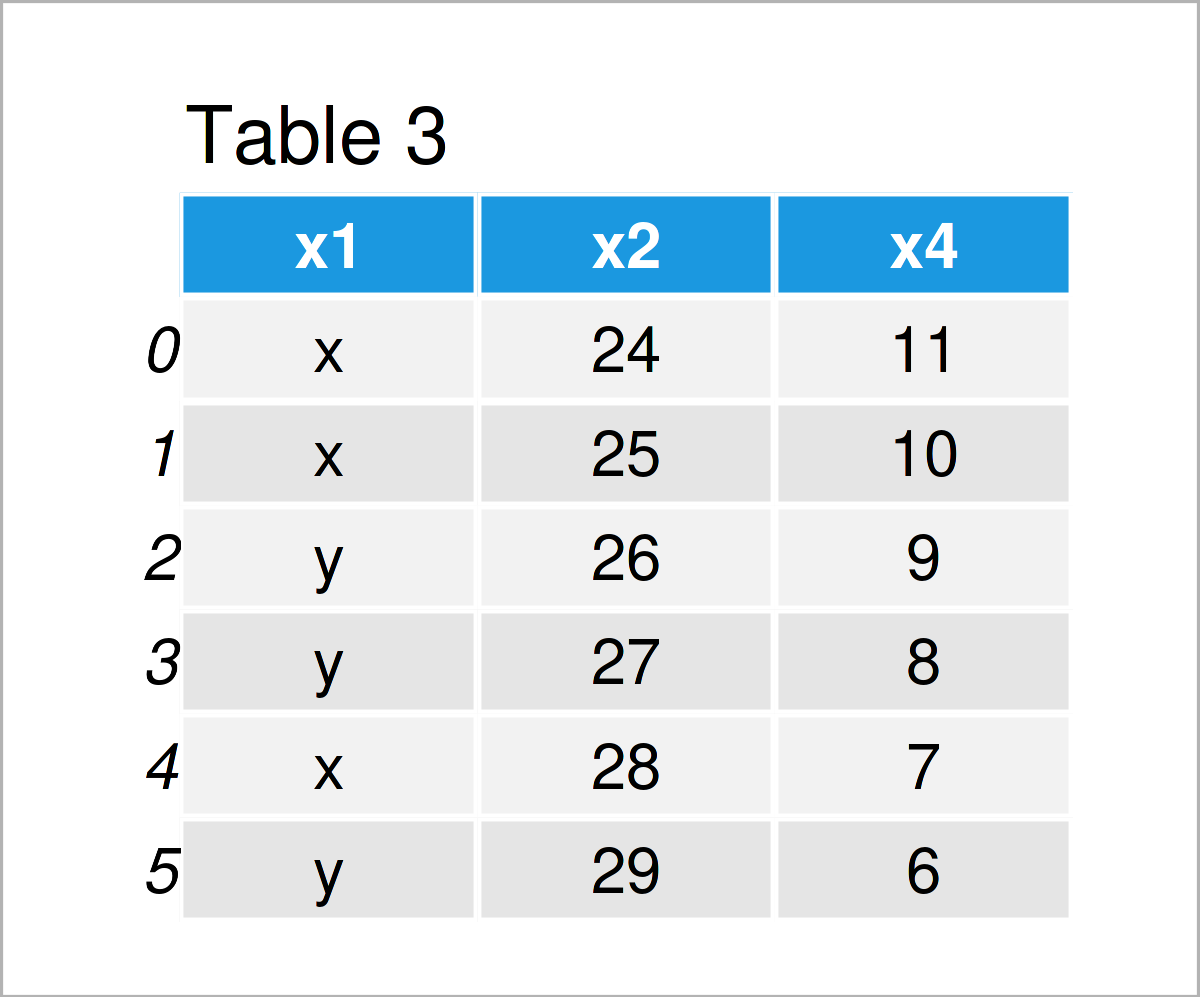
After running the previous syntax the new data matrix shown in Table 3 has been created. As you can see, we have deleted the variable x3 from our input DataFrame.
Example 3: Add New Row to pandas DataFrame
In the previous examples, we have modified the columns of a pandas DataFrame.
In this example, I’ll explain how to add a new row at the bottom of a DataFrame.
As in Example 1, we first have to create a list that we can append to our data set later on:
new_row = ["a", "b", "c", "d"]                             # Create list
print(new_row)                                             # Print list
Next, we can use the loc function to add this list as a new row to the bottom of our DataFrame:
data_new3 = data.copy()                                    # Create copy of DataFrame
data_new3.loc[6] = new_row                                 # Append new row to DataFrame
print(data_new3)                                           # Print updated DataFrame
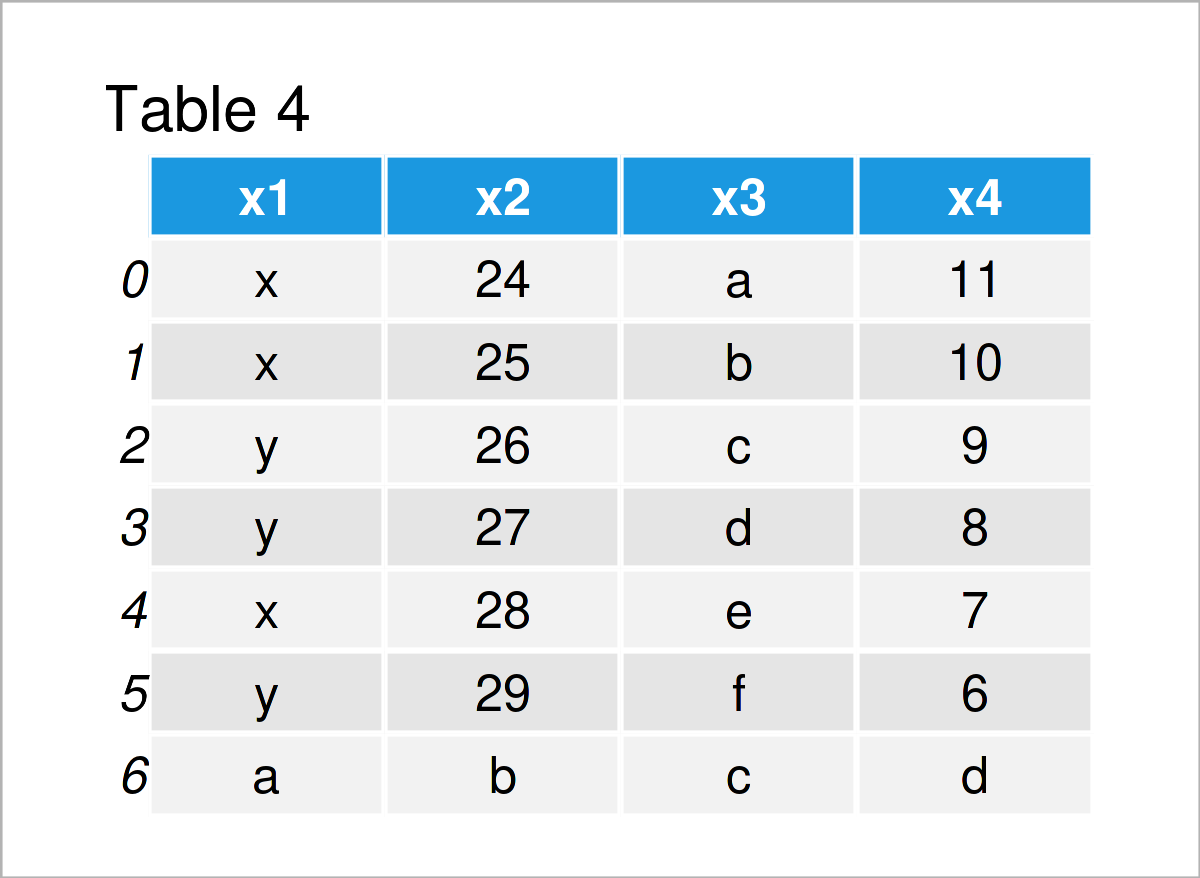
The previously shown table illustrates the structure of our new DataFrame. As you can see, we have added a new row in the last line of these data.
Example 4: Remove Row from pandas DataFrame
This example illustrates how to delete a row from a pandas DataFrame in Python.
To achieve this, we have to specify a logical condition based on which certain rows should be kept or removed.
In this specific example, we’ll exclude all rows from our data where the column x1 is not equal to “x”.
data_new4 = data[data.x1 == "x"]                           # Remove certain rows
print(data_new4)                                           # Print DataFrame subset
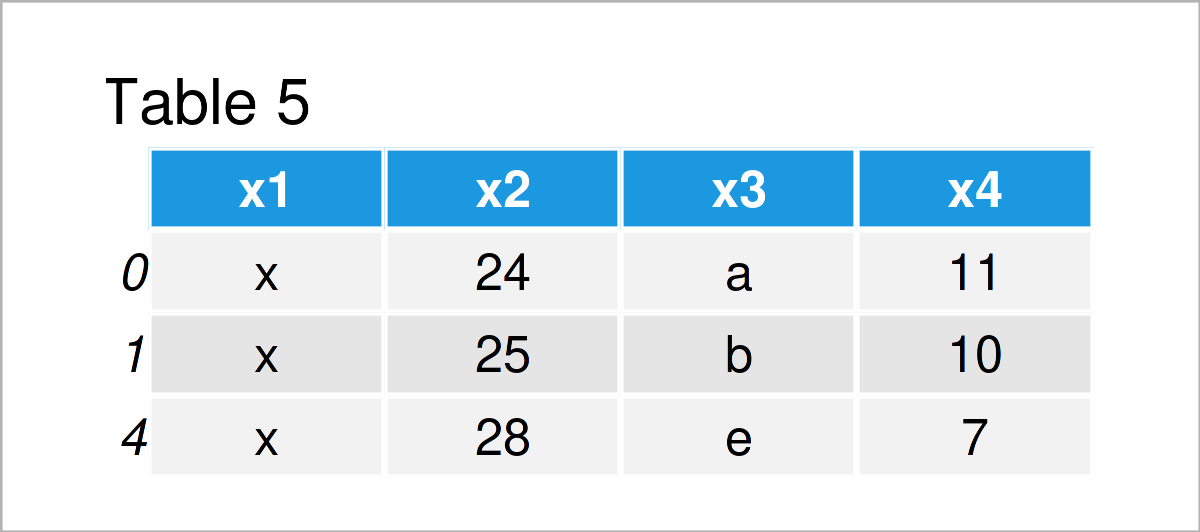
The output of the previous Python programming code is shown in Table 4: A subset of our DataFrame where only particular rows have been retained.
Example 5: Calculate Standard Deviation for pandas DataFrame Column
Until now, we have performed different manipulations on our DataFrame.
However, it’s also possible to analyze a pandas DataFrame in Python.
This specific example explains how to calculate the standard deviation of one column of our data set.
Consider the Python syntax below:
data_x2_std = data["x2"].std()                             # Calculate standard deviation
print(data_x2_std)                                         # Print standard deviation
# 1.8708286933869707
As you can see, the standard deviation of the column x2 is equal to 1.87.
Video & Further Resources
In case you need further information on the Python programming code of the present page, you could have a look at the following video on my YouTube channel. I’m explaining the contents of this page in the video.
The YouTube video will be added soon.
Furthermore, you may want to read some of the other tutorials on this homepage.
- Change pandas DataFrames in Python
- DataFrame Manipulation Using pandas in Python
- How to Use the pandas Library in Python
- Introduction to Python
In this Python tutorial you have learned how to use the functions of the pandas library. Let me know in the comments, if you have further comments and/or questions. Furthermore, please subscribe to my email newsletter to get updates on new tutorials.


