Rotate Plot in R (3 Examples)
In this tutorial you’ll learn how to draw a rotated graphic in the R programming language.
Table of contents:
Let’s get started.
Creation of Example Data
First and foremost, we’ll need to define some example data:
data <- data.frame(x = 1:5,                    # Create example data
                   y = c(3, 2, 4, 2, 5))
data                                           # Print example data
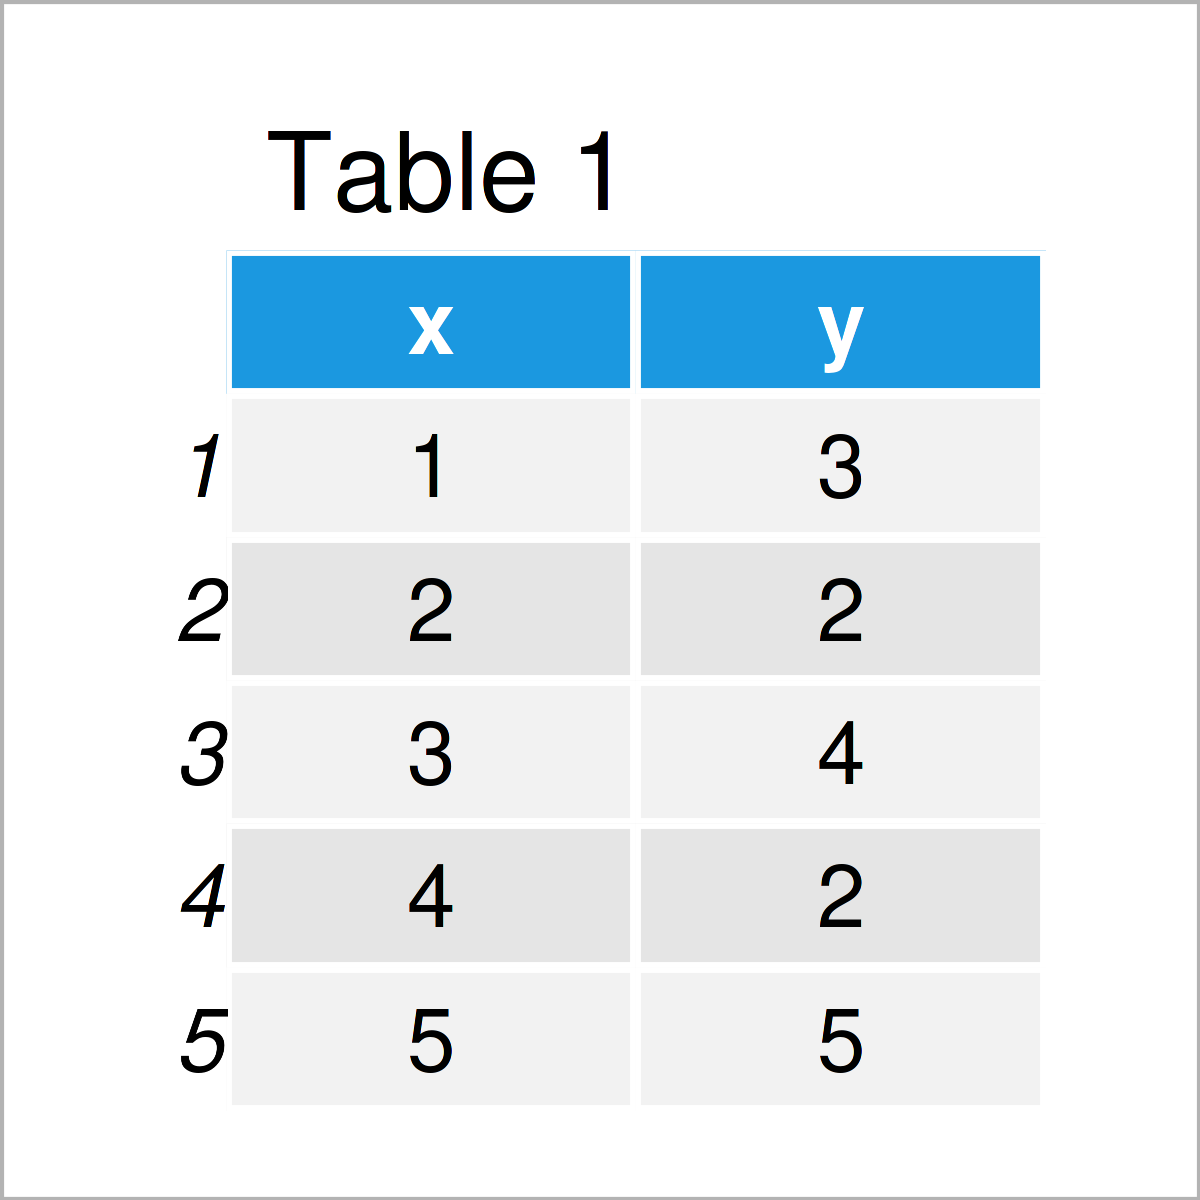
The previous table shows that our example data is made of five rows and two columns.
Example 1: Rotate Base R Plot
The following R programming code illustrates how to rotate a Base R plot.
Consider the following example plot:
plot(data, type = "l") # Draw plot without rotation
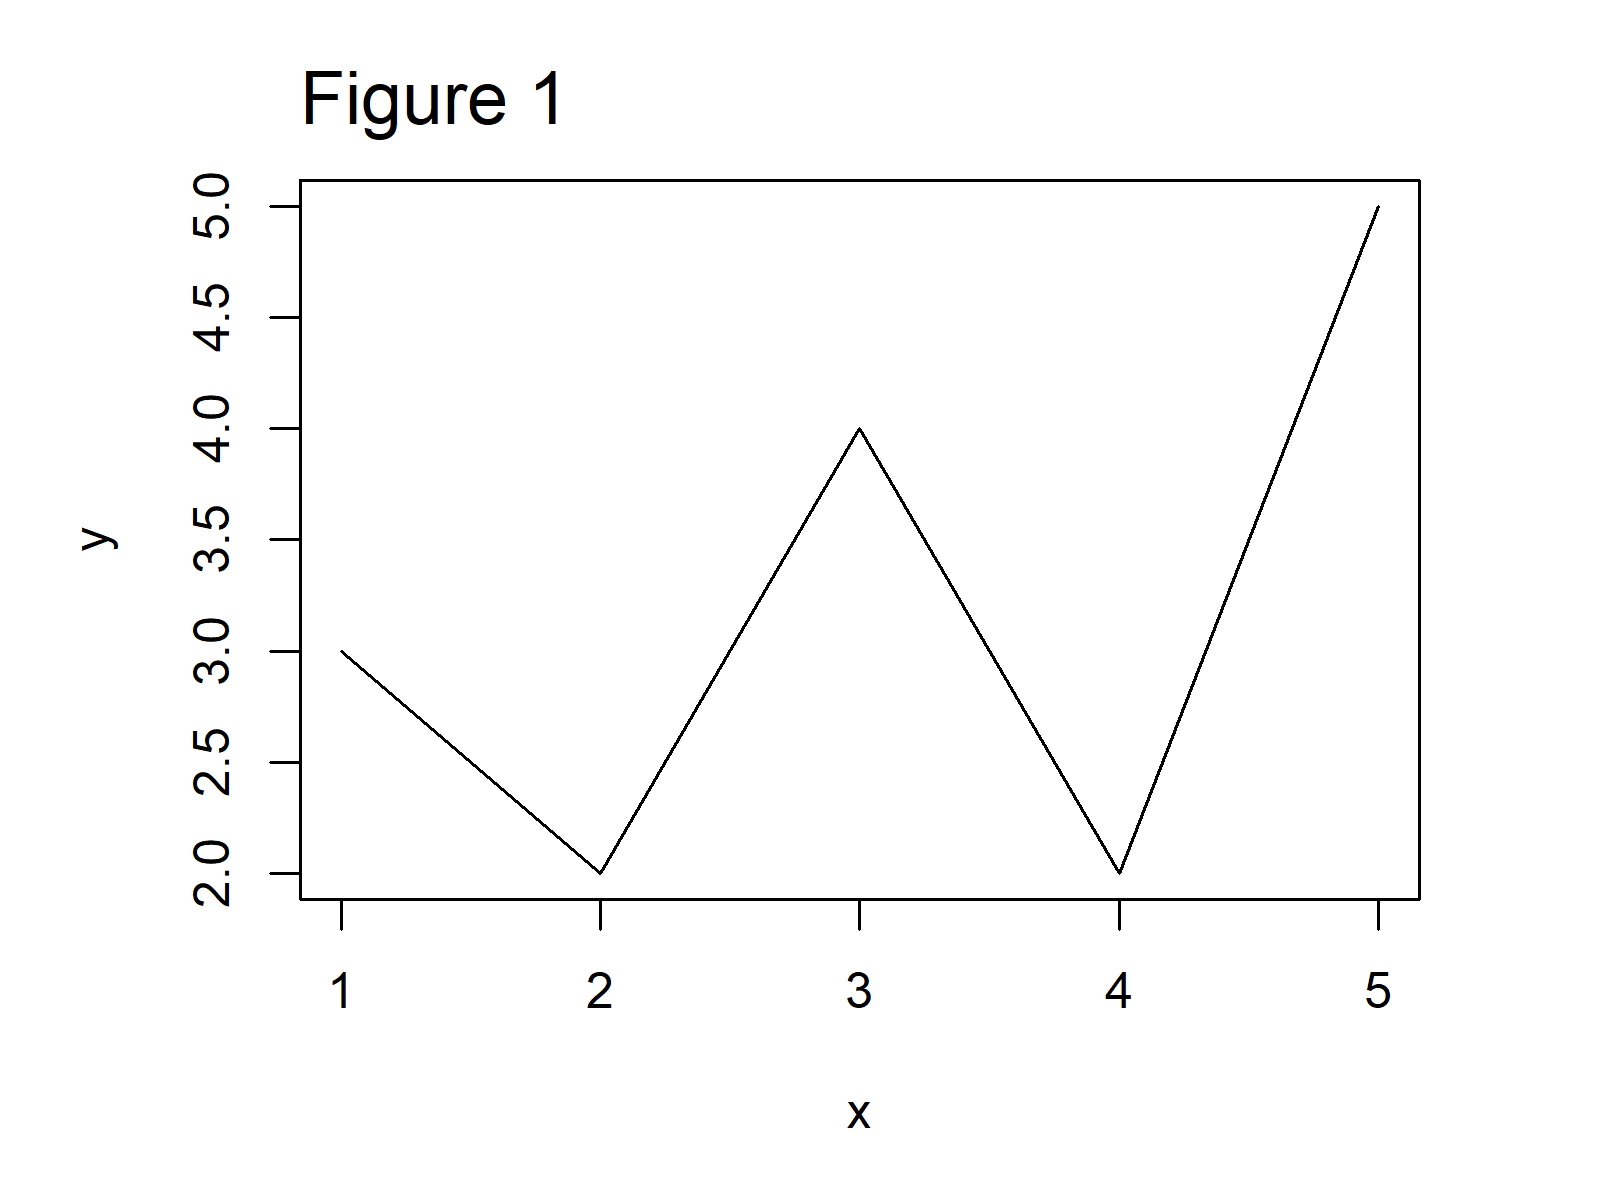
After executing the previous code the Base R line chart revealed in Figure 1 has been created.
To rotate our plot, we can use the functions of the gridGraphics package. To be able to use the functions of the gridGraphics package, we first need to install and load gridGraphics:
install.packages("gridGraphics")               # Install gridGraphics package
library("gridGraphics")                        # Load gridGraphics package
Next, we have to construct a user-defined function that combines the grid.echo and grid.grab commands provided by the gridGraphics package:
fun_grob <- function(){                        # Create user-defined function
  grid.echo()
  grid.grab()
}
We can now apply this user-defined function to create a gTree grob output:
fun_grob_out <- fun_grob() # Store grob output
Finally, we can use this gTree object in combination with the grid.newpage, pushViewport, viewport, and grid.draw functions to rotate our Base R graph:
grid.newpage()                                 # Create new plot page
pushViewport(viewport(width = 0.6,             # Create grid viewport
                      height = 0.6,
                      angle = 25))
grid.draw(fun_grob_out)                        # Draw rotated plot
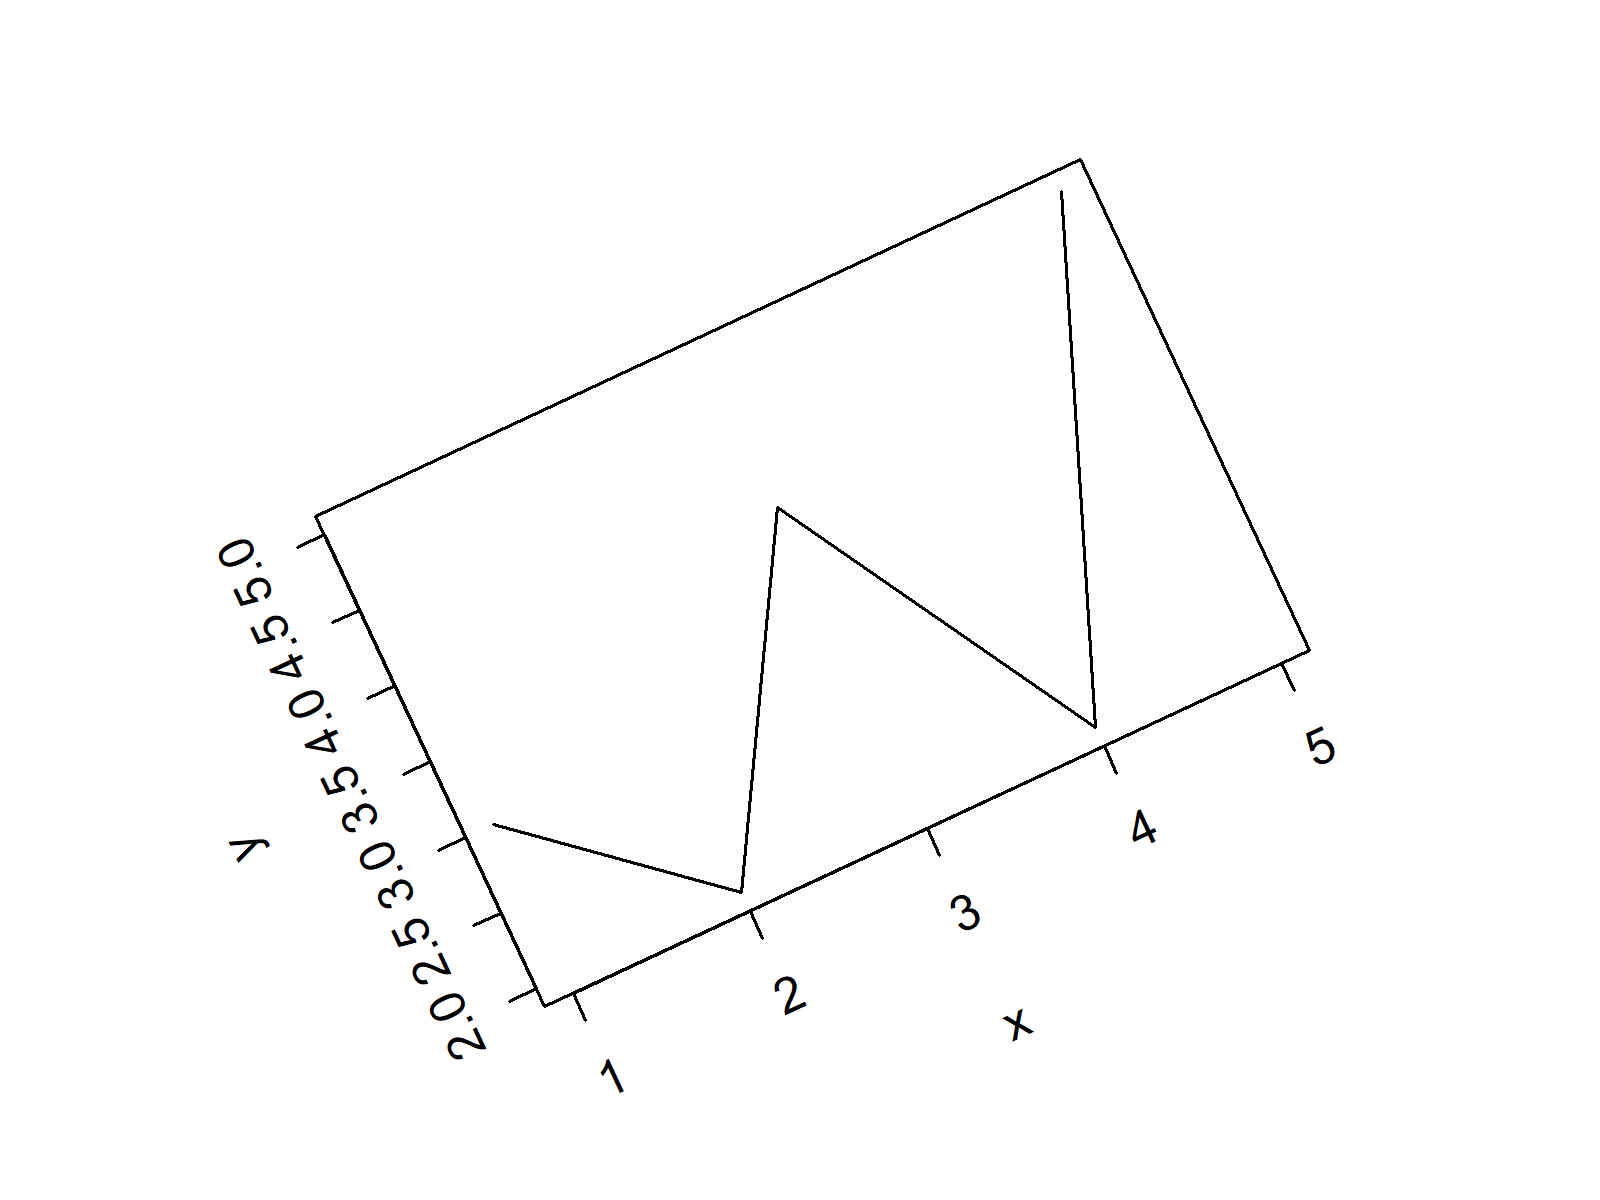
Figure 2 shows our example plot rotated with an angle of 25. You may change this angle within the viewport function to your personal preferences.
Example 2: Rotate ggplot2 Plot
The following R programming code shows how to rotate a ggplot2 plot in R.
We first have to install and load the ggplot2 package, in order to use the corresponding functions:
install.packages("ggplot2")                    # Install ggplot2 package
library("ggplot2")                             # Load ggplot2 package
Next, we can create a ggplot2 line plot without rotation:
ggp <- ggplot(data, aes(x, y)) +
  geom_line()
ggp
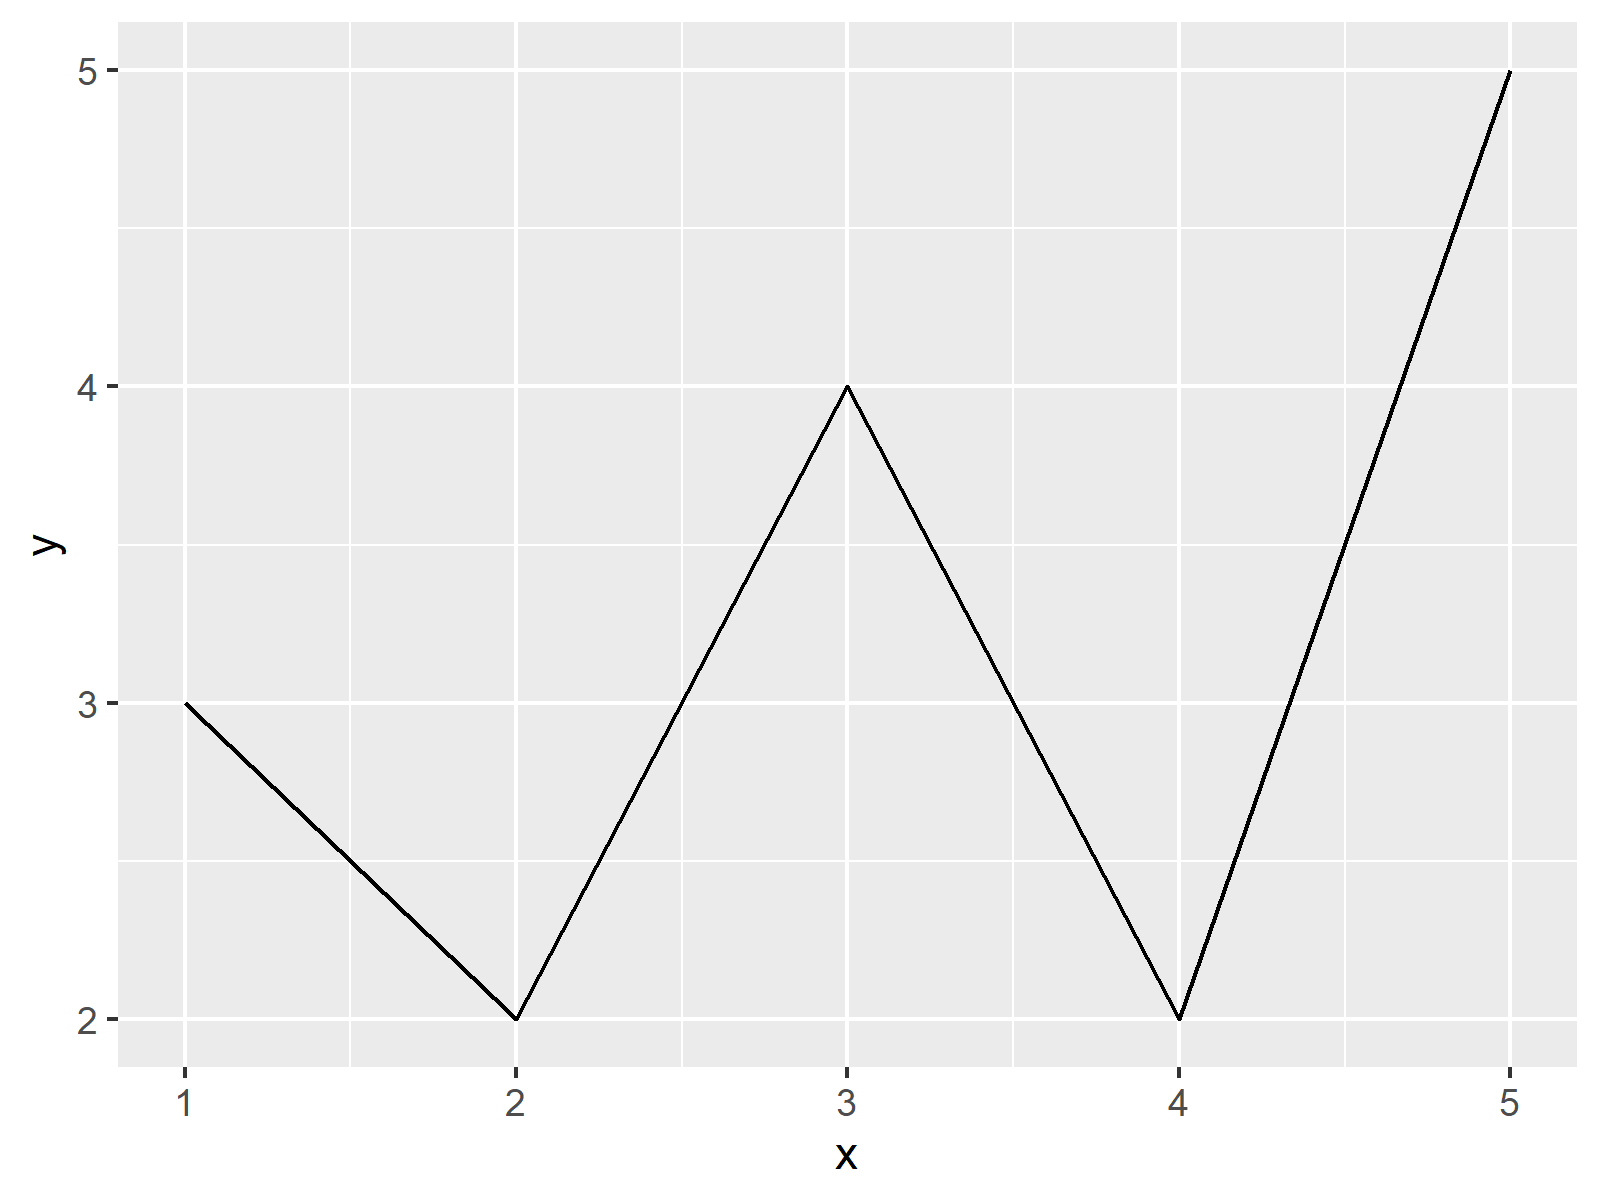
Figure 2 shows the output of the previous R programming syntax: A ggplot2 line chart.
If we want to rotate this ggplot2 plot, we can use the grid.newpage, print, and viewport functions as shown in the following R code:
grid.newpage()                                 # Create new plot page
print(ggp,                                     # Draw rotated plot
      vp = viewport(width = 0.6,
                    height = 0.6,
                    angle = 25))
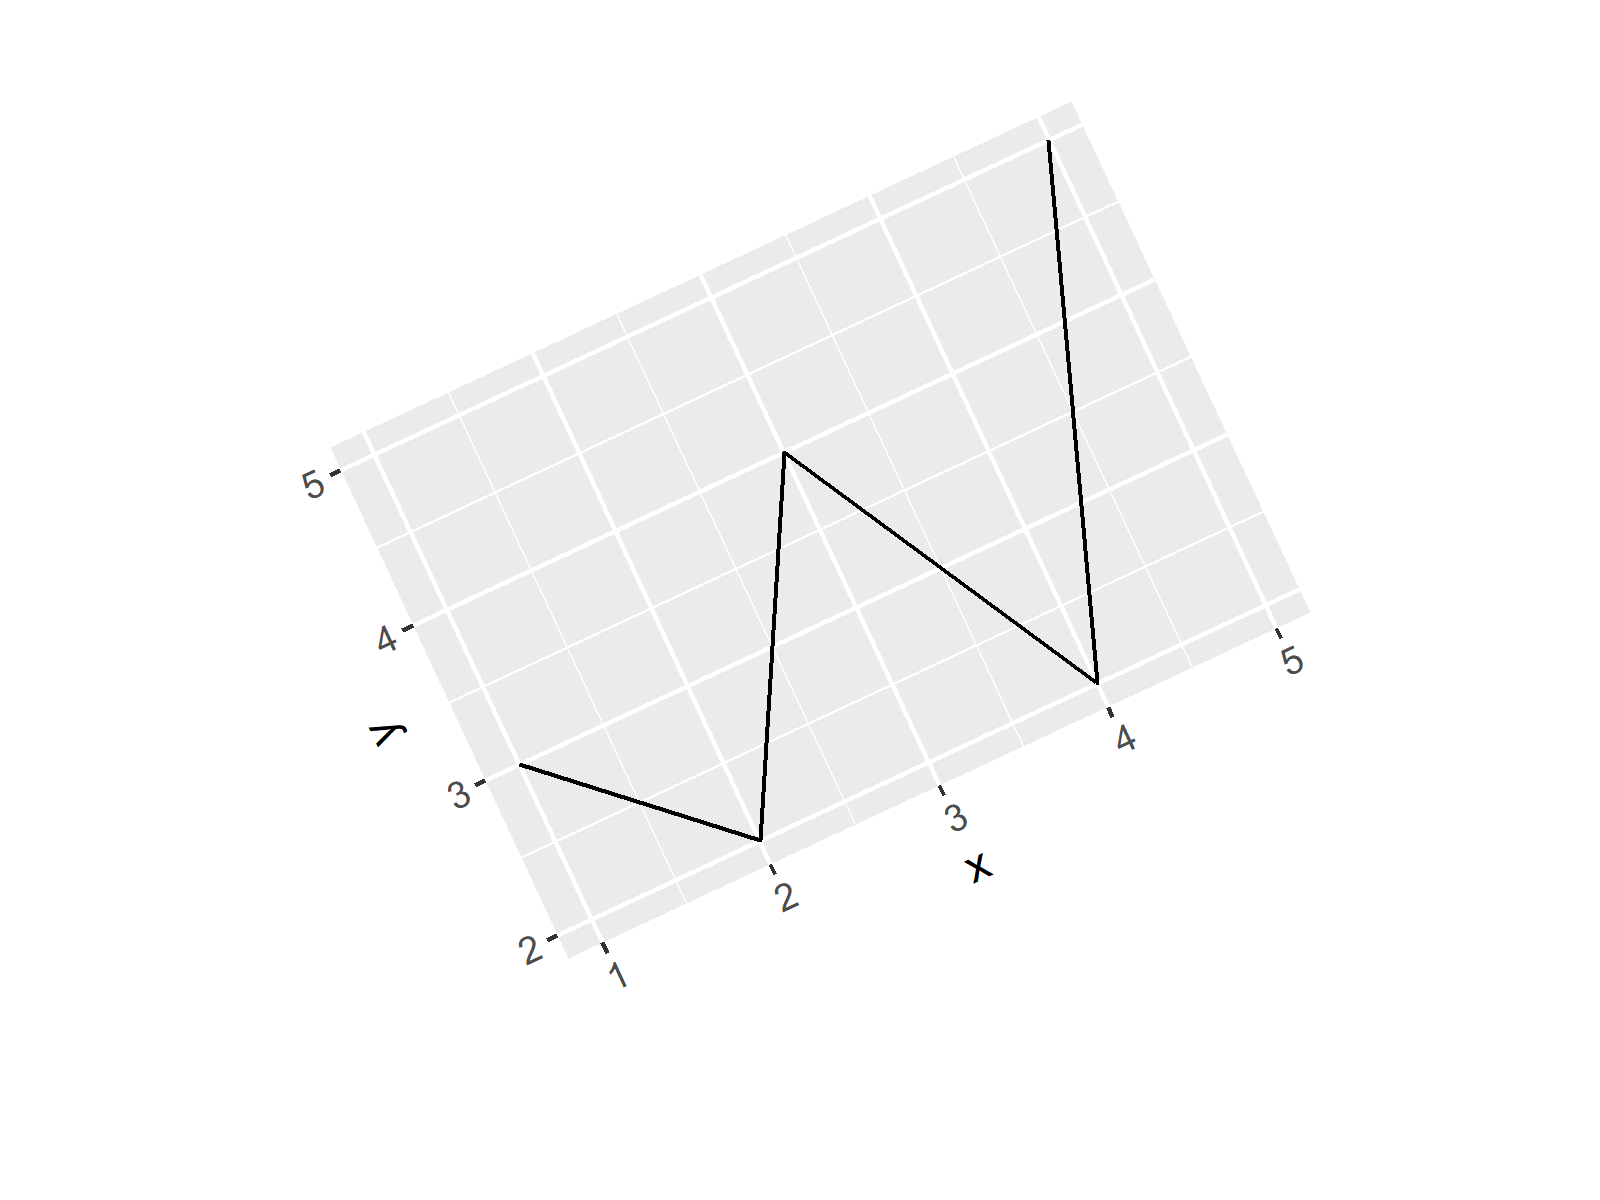
In Figure 4, our rotated ggplot2 plot is visualized.
Example 3: Draw Rotated ggplot2 Plot on Top of Other Plot
In the previous examples, we have drawn rotated plots on a blank background.
In this section, I’ll demonstrate how to add a rotated ggplot2 plot on top of an already existing graphic.
Let’s first create another ggplot2 plot object for the background:
ggp_background <- ggplot(data, aes(x, y)) +    # Create ggplot2 plot for background
  geom_point()
ggp_background                                 # Draw background plot
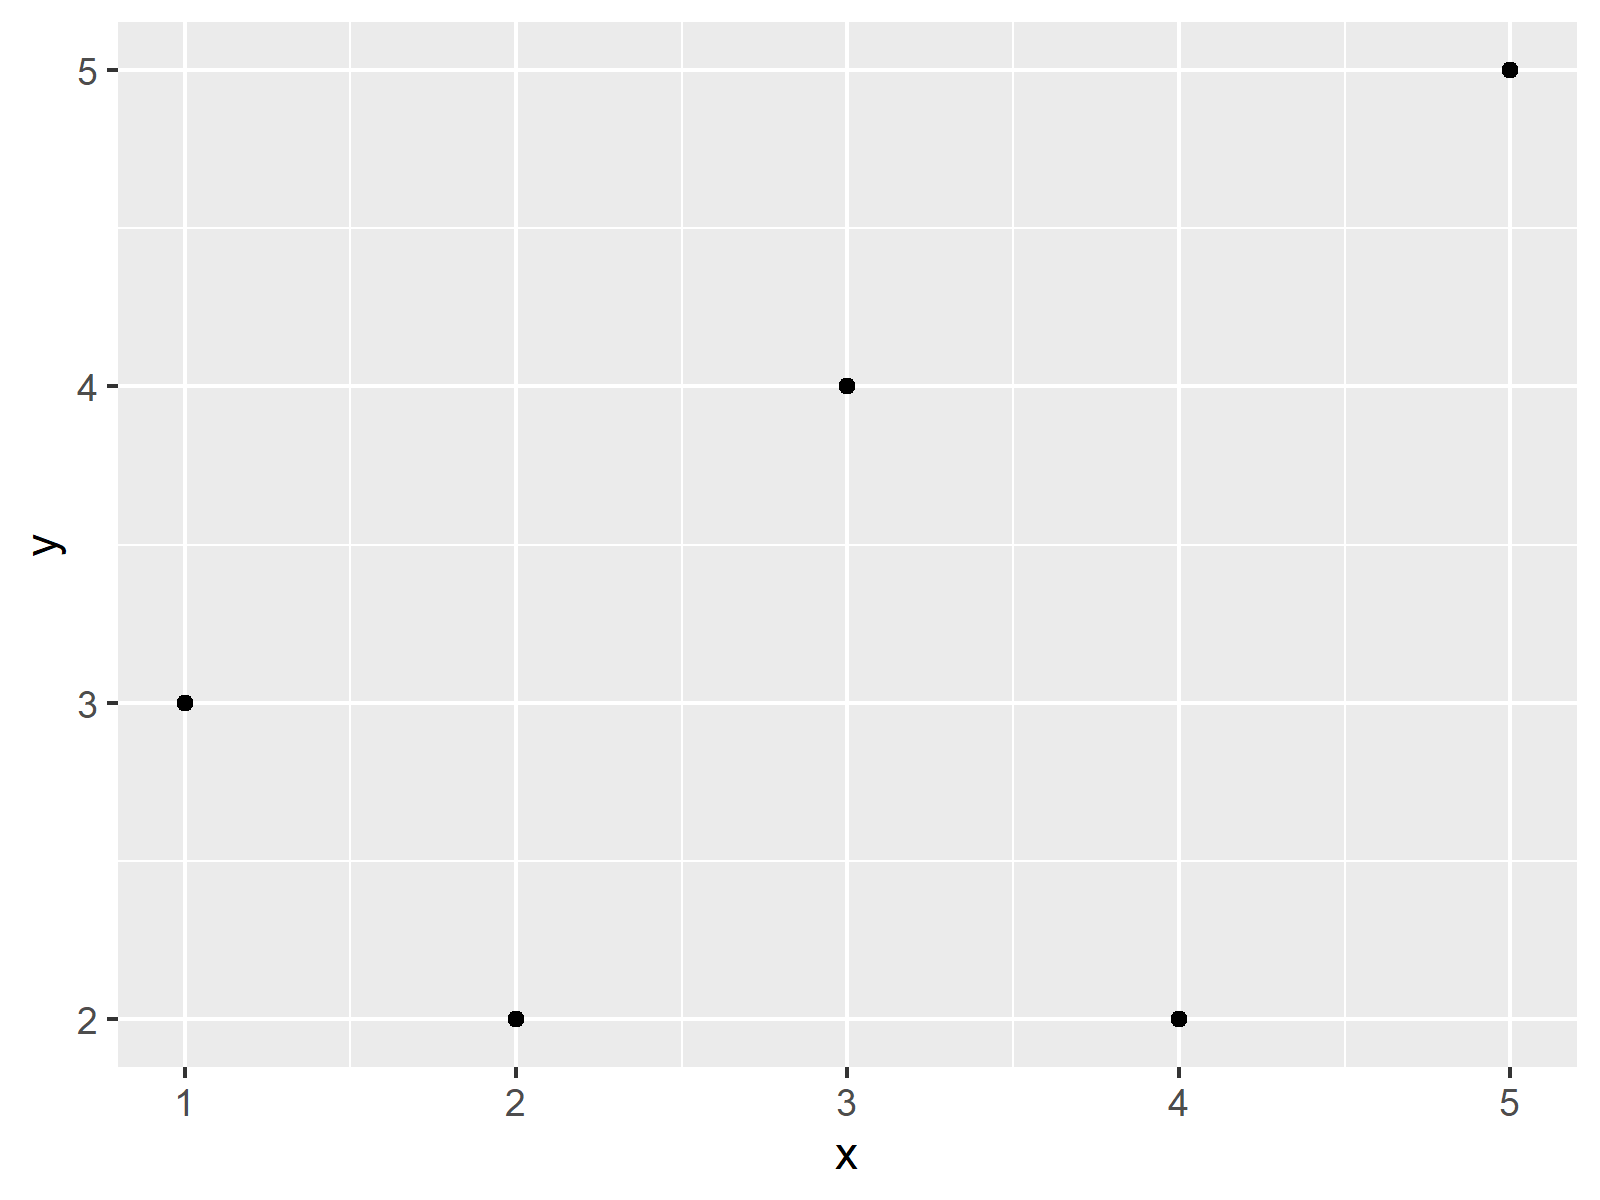
As shown in Figure 3, we have managed to create a ggplot2 scatterplot using the previous code.
If we want to draw this ggplot2 scatterplot as well as our previously created rotated line chart on top of this plot, we can use the following R code. Note that we are not using the grid.newpage function this time:
ggp_background                                 # Draw background plot
print(ggp,                                     # Draw rotated plot on top
      vp = viewport(width = 0.6,
                    height = 0.6,
                    angle = 25))
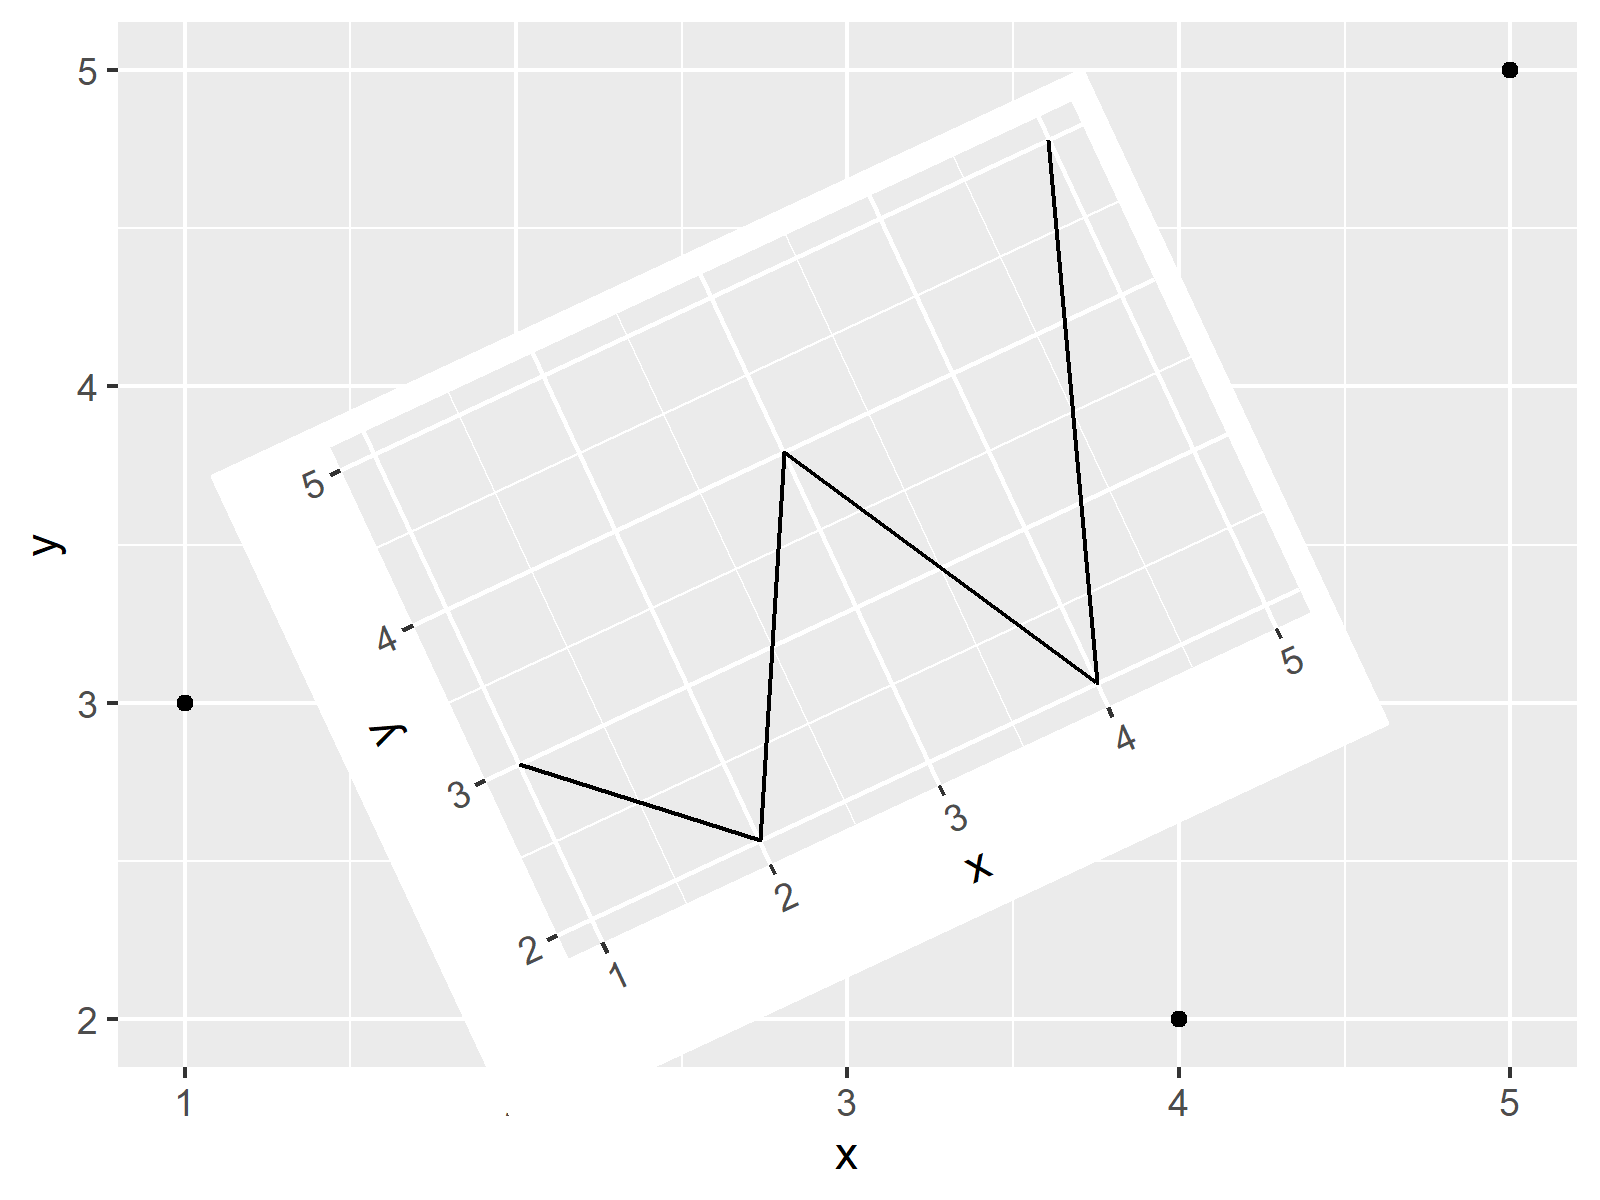
Figure 6 illustrates the output of the previous R code: A rotated ggplot2 line chart on top of a ggplot2 scatterplot without rotation.
In this specific tutorial, we have used line charts and scatterplots. However, please note that we could apply the same syntax to other types of graphics such as barcharts, boxplots, density plots, heatmaps, and so on.
Video & Further Resources
I have recently published a video on my YouTube channel, which shows the R programming codes of this post. You can find the video below:
In addition, you may want to have a look at the related tutorials on this website:
- Rotate Annotated Text in ggplot2 Plot
- Rotate Axis Labels of Base R Plot
- Graphics Gallery in R
- Introduction to R Programming
You have learned in this article how to rotate a graph by a certain angle in the R programming language. In case you have further questions, let me know in the comments section.


