Return data.frame Class when Using dplyr Package in R (Example)
In this R programming article you’ll learn how to get a data.frame output when using the dplyr package.
The post will contain one example for the printing of a data.frame output when using the dplyr package. To be more precise, the page looks as follows:
Let’s get started…
Example Data & Add-On Packages
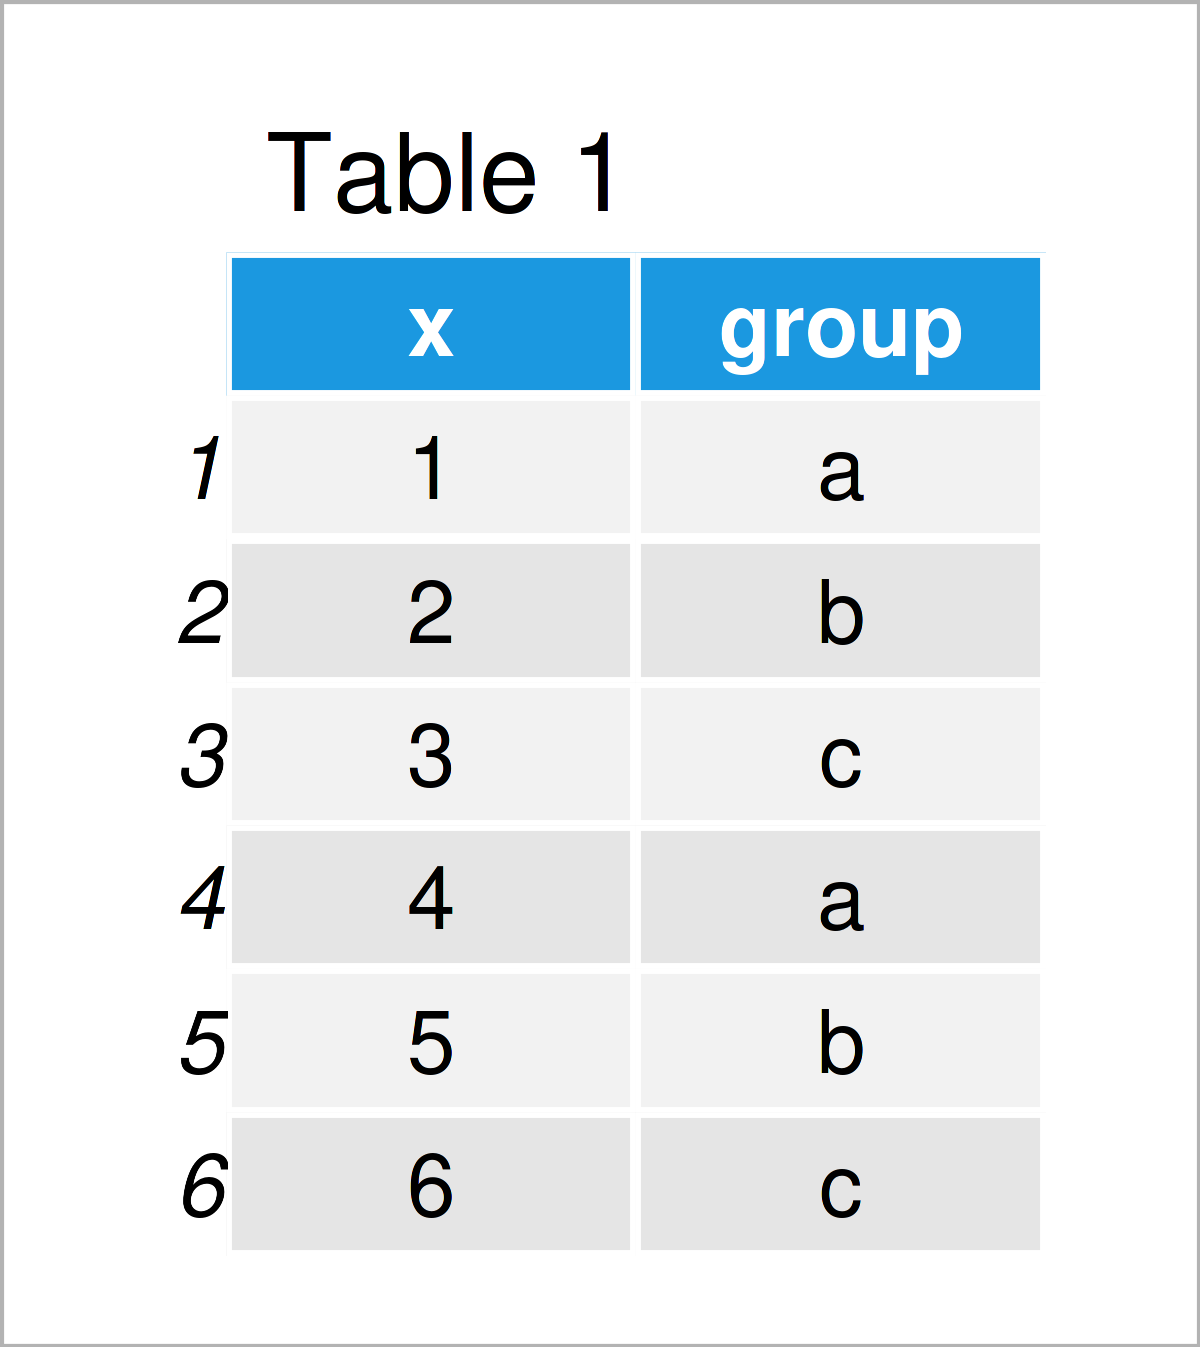
Have a look at the exemplifying data below:
data <- data.frame(x = 1:6,        # Create example data frame
                   group = letters[1:3])
data                               # Print example data frame

Table 1 shows the structure of our example data: It is made of six rows and two columns. The variable x is an integer and the variable group is a character.
We also have to install and load the dplyr package, if we want to use the functions that are included in the package:
install.packages("dplyr")          # Install & load dplyr
library("dplyr")
We could now apply some dplyr operations as shown below:
data_tibble <- data %>%            # Return tibble when using dplyr
  group_by(group) %>%
  dplyr::summarize_at(vars(x),
                      list(mean = mean))
data_tibble
# # A tibble: 3 x 2
# group  mean
# <chr> <dbl>
# 1 a       2.5
# 2 b       3.5
# 3 c       4.5
The previous R code has calculated the mean by group.
However, in this tutorial, we are interested in the class of the output. Let’s check this:
class(data_tibble)                 # Check class of output
# [1] "grouped_df" "tbl_df"     "tbl"        "data.frame"
As you can see, the previous R code has created a tibble object.
This is fine, but if you prefer to work with the data.frame class, you might be interested in learning how to return a data.frame when using the dplyr package.
Keep on reading to learn more!
Example: Get Data Frame Output when Using dplyr Package Using as.data.frame() Function
The following R code explains how to return a data.frame instead of a tibble when using functions of the dplyr package.
To achieve this, we can apply the as.data.frame function at the end of our syntax as shown below:
data_df <- data %>%                # Adding as.data.frame function at end of code
  group_by(group) %>%
  dplyr::summarize_at(vars(x),
                      list(mean = mean)) %>%
  as.data.frame()
data_df
#   group mean
# 1     a  2.5
# 2     b  3.5
# 3     c  4.5
By executing the previous R programming syntax, we have created a data object called data_df. Let’s print the data type of this object:
class(data_df)                     # Check class of output
# [1] "data.frame"
It’s a data.frame – great!
Video & Further Resources
Have a look at the following video on my YouTube channel. In the video, I’m demonstrating the examples of this tutorial.
Furthermore, you could read the other tutorials which I have published on my website:
- is.data.frame & as.data.frame Functions in R
- Extract Column of dplyr Tibble in R
- Reshape Data Frame from Wide to Long Format
- R Programming Examples
This article has shown how to return a data.frame output when using the dplyr package in the R programming language. If you have any further questions or comments, please let me know in the comments section. Furthermore, don’t forget to subscribe to my email newsletter to get regular updates on the newest articles.


