How to Fix the R Error in stripchart.default(x1, …) : invalid plotting method
This article explains how to get rid of the “Error in stripchart.default(x1, …) : invalid plotting method” in R.
The tutorial contains the following:
Let’s do this…
Introducing Example Data
First of all, we need to construct some example data:
data <- data.frame(x = 1:5,     # Create example data
                   y = 9:5)
data                            # Print example data

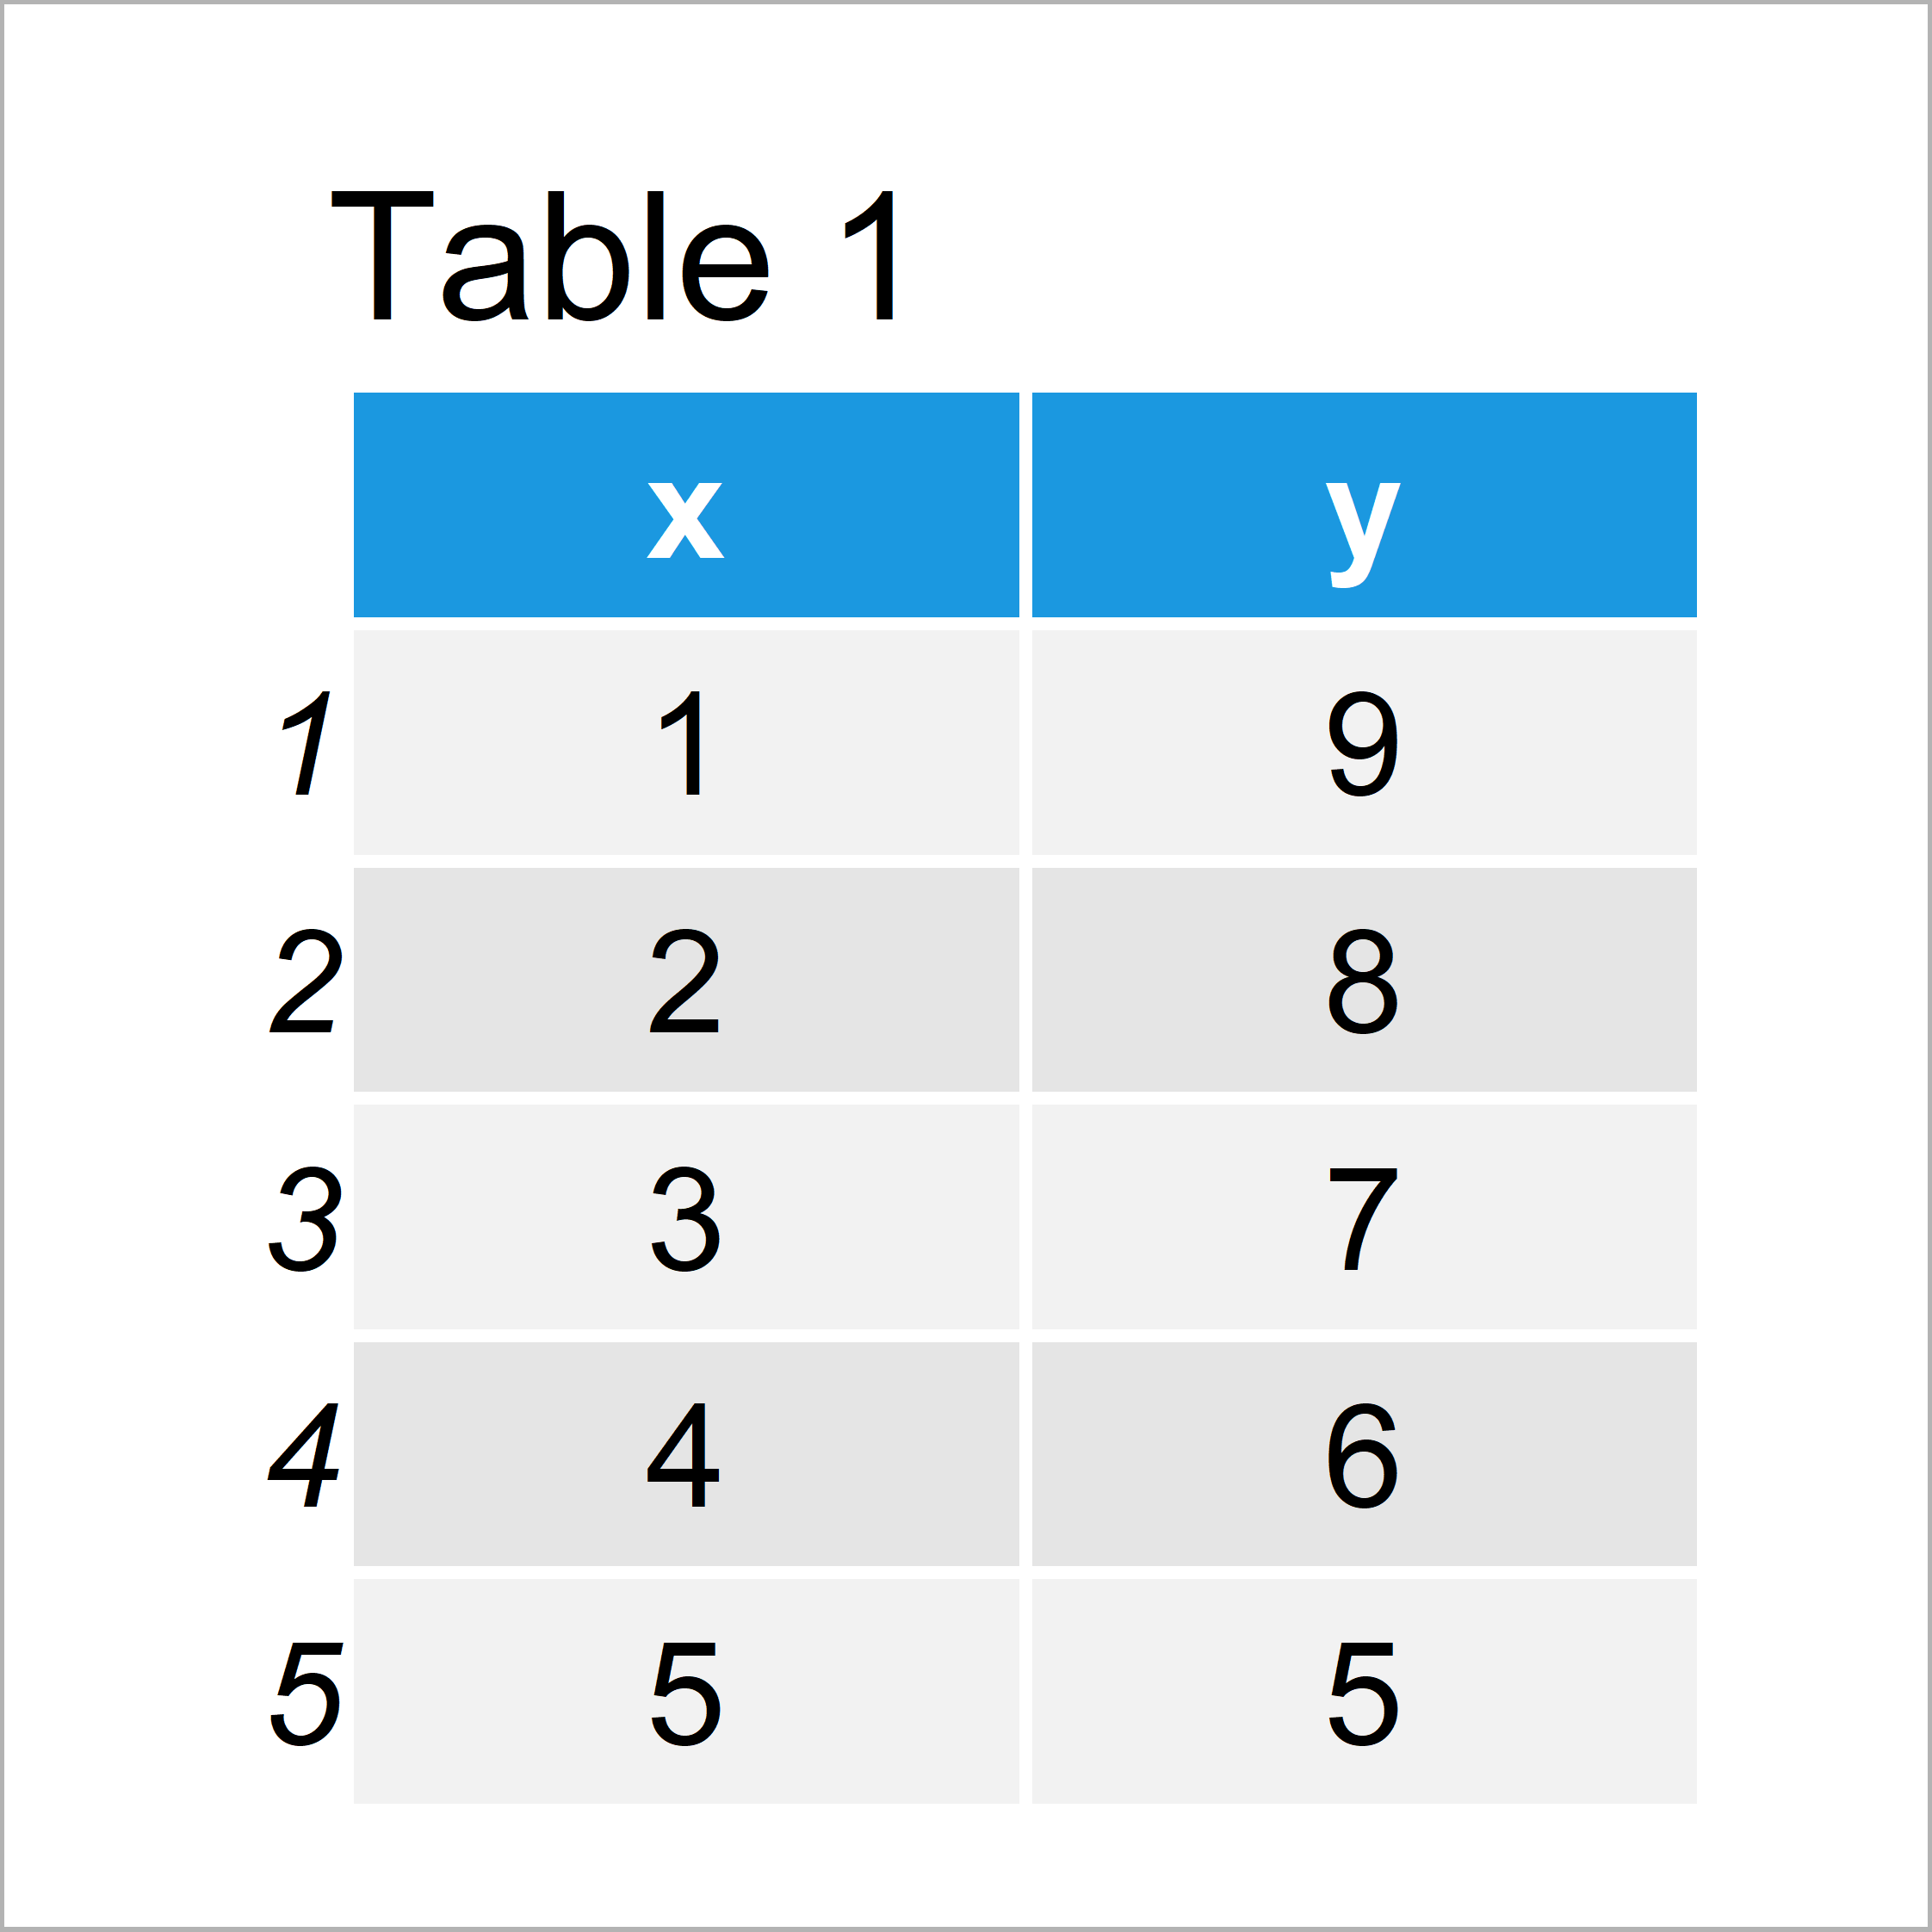
As you can see based on Table 1, our example data is a data frame containing five rows and two variables. Let’s assume that we want to create a simple plot based on these two data frame columns…
Example 1: Replicate the Error in stripchart.default(x1, …) : invalid plotting method
Example 1 explains how to reproduce the R programming “Error in stripchart.default(x1, …) : invalid plotting method”.
To create our simple scatterplot, we may try to use the plot() function as shown below:
plot(data[1], data[2])          # Try to create plot
# Error in stripchart.default(x1, ...) : invalid plotting method
Unfortunately, the RStudio console returns the “Error in stripchart.default(x1, …) : invalid plotting method”.
The reason for this is that our input data has the data.frame:
class(data[1])                  # Check class of data input
# [1] "data.frame"
The plot function does not take data frames as input. But how can we fix this problem?
Example 2: Fix the Error in stripchart.default(x1, …) : invalid plotting method
Example 2 explains how to deal with the “Error in stripchart.default(x1, …) : invalid plotting method”.
As mentioned in Example 1, we have tried to insert a data frame as input to the plot function. However, we can easily extract a single integer or numeric column from our data frame by specifying a comma when subsetting our data:
class(data[ , 1])               # Check class of data input
# [1] "integer"
Let’s use this method to draw a simple graphic of our data:
plot(data[ , 1], data[ , 2]) # Apply plot function to proper data

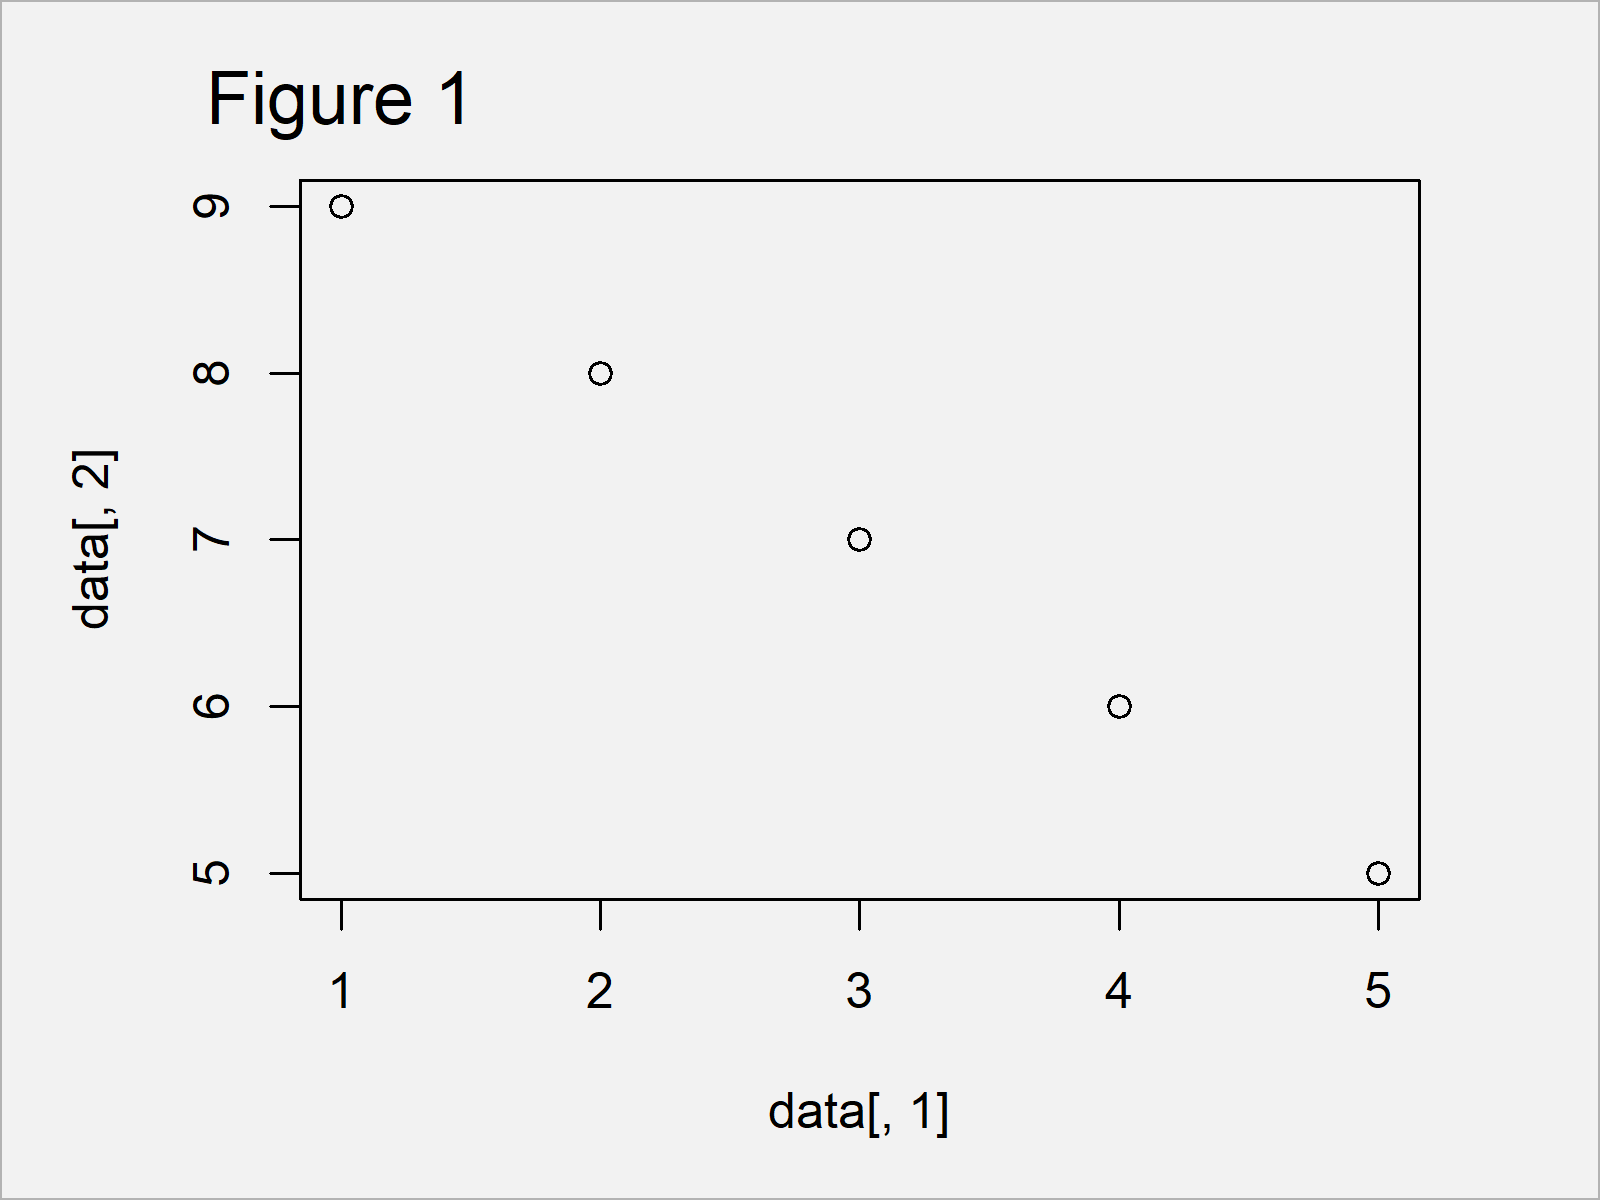
As shown in Figure 1, we have created a scatterplot showing the variables x and y.
Video, Further Resources & Summary
If you need more information on the contents of this post, I can recommend watching the following video of my YouTube channel. In the video, I’m explaining the R syntax of this article.
The YouTube video will be added soon.
Furthermore, you may have a look at the related tutorials of this website.
Summary: In this post, I have explained how to avoid the “Error in stripchart.default(x1, …) : invalid plotting method” in the R programming language. Let me know in the comments section below, if you have further questions.


