ggplot2 Error in R: Must be Data Frame not S3 Object with Class Uneval
In this article you’ll learn how to handle the ggplot2 error message “data` must be a data frame, or other object coercible by `fortify()`, not an S3 object with class uneval” in the R programming language.
The article is structured as follows:
Let’s dig in!
Example Data, Packages & Default Plot
First, let’s construct some example data in R:
data <- data.frame(x = 4:9,        # Create example data
                   y = 1:6)
data                               # Print example data
#   x y
# 1 4 1
# 2 5 2
# 3 6 3
# 4 7 4
# 5 8 5
# 6 9 6
The previous output of the RStudio console shows the structure of our example data: It consists of six rows and two numeric columns.
If we want to use the functions of the ggplot2 package, we also have to install and load ggplot2:
install.packages("ggplot2")        # Install ggplot2 package
library("ggplot2")                 # Load ggplot2 package
That’s it with the preparation. Let’s move on the examples!
Example 1: Reproduce the Error: `data` must be a data frame, or other object coercible by `fortify()`
The following R programming code shows how to replicate the error “data` must be a data frame, or other object coercible by `fortify()`, not an S3 object with class uneval” in R.
Have a look at the following ggplot2 syntax:
ggplot(aes(data, x, y)) +          # Try to draw ggplot2 plot
  geom_point()
# Error: `data` must be a data frame, or other object coercible by `fortify()`, not an S3 object with class uneval
# Did you accidentally pass `aes()` to the `data` argument?
As you can see, the error message “data` must be a data frame, or other object coercible by `fortify()`, not an S3 object with class uneval” was returned by the RStudio console.
The reason for this is that we have specified our data at the wrong position, i.e. within the aes function.
So how can we solve this problem? Keep on reading!
Example 2: Fix the Error: `data` must be a data frame, or other object coercible by `fortify()`
In Example 2, I’ll show how to fix the error message “data` must be a data frame, or other object coercible by `fortify()`, not an S3 object with class uneval”.
For this, we have to specify our data outside of the aes function:
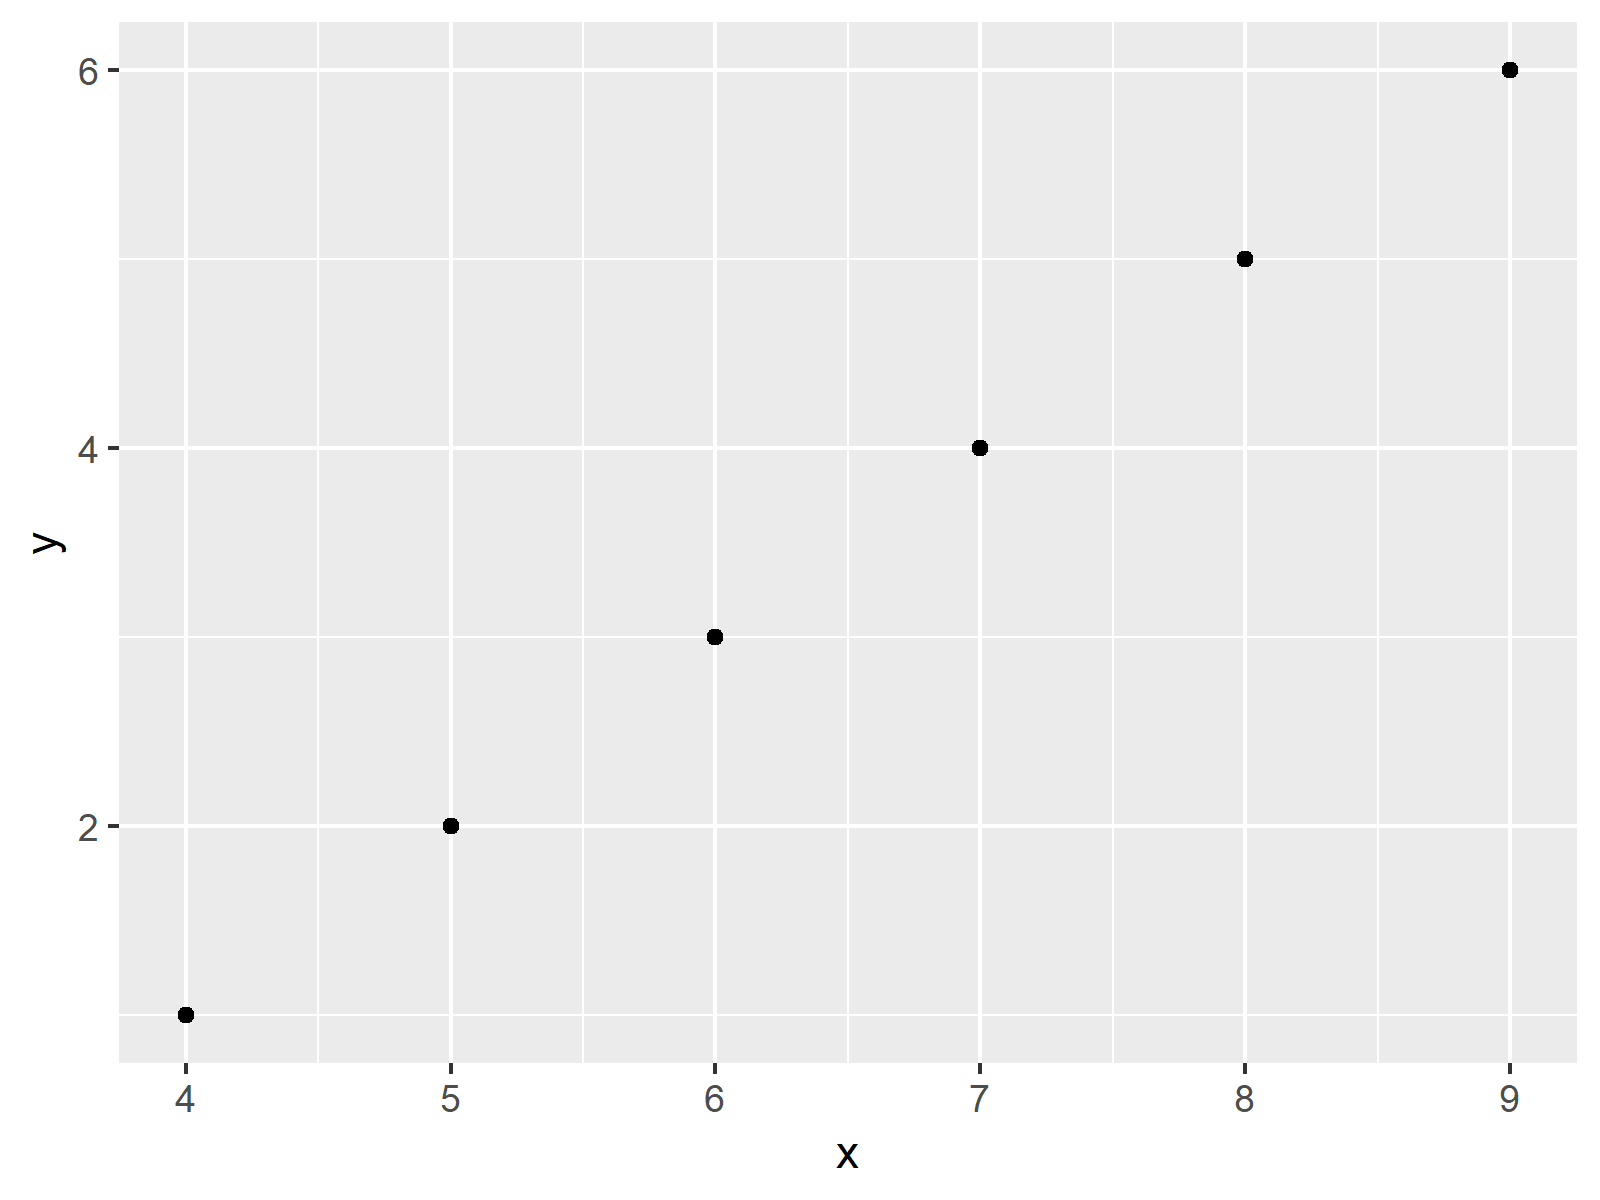
ggplot(data, aes(x, y)) +          # Properly draw ggplot2 plot
  geom_point()

The output of the previous R syntax is shown in Figure 1 – Looks good!
Video & Further Resources
Do you want to know more about errors and warnings in the R programming language? Then you might want to watch the following video of my YouTube channel. I illustrate the topics of this tutorial in the video.
The YouTube video will be added soon.
Besides that, you could have a look at the other tutorials which I have published on my website. You can find some articles below:
- ggplot2 Error: Aesthetics must be either length 1 or the same as the data
- ggplot2 Error: stat_count() must not be used with a y aesthetic
- Introduction to R
To summarize: You learned in this article how to deal with the error “data` must be a data frame, or other object coercible by `fortify()`, not an S3 object with class uneval” in the R programming language. Please let me know in the comments, if you have any additional questions.


12 Comments. Leave new
Thank you so much, it solved my problem!
Thank you yasaman, glad to hear that it helped!
I have separated my data from aes but I am still getting the same error. Any thoughts? I have a date/time variable and a salinity variable I am wanting to plot as a scatterplot.
Hey Ashley,
Could you please share your code?
Regards
Joachim
Sir i have same kind of data and i want to draw a scatter plot but facing error, data nature given below
Reffrel Disease No of Patient reffer
Acute gastritis 11
Hernia 10
Chronic kidney disease (CKD) 44
Fracture 8
Vascular surgery encompasses 7
Sever Anemia 60
Wellens Syndrome 2
Acute limb Ischemia 1
Ventilator Care 2
Road Traffic accident (RTA) 159
Neurosurgeons opinion 15
Renal Failur 6
Twin Pregnancy 3
Blunt Trauma 1
Pyrexia of unknown origin (PUO) 6
Deep vein thrombosis (DVT 3
Non-ST-elevation myocardial infarction (NSTEMI) 2
wheat pills intake 11
Hey Ameeq,
Please excuse the delayed response. I was on a long vacation, so unfortunately I wasn’t able to get back to you earlier. Do you still need help with your code?
Regards,
Joachim
I want to mention disease name on X-axis , and Number of patients mention on Y-Axis
Thanks for the further clarifications.
Regards,
Joachim
Yes sir i need help.
My Data type mention below
Disease Name : LRTI, COPD, TB
Number of patient: 2,5,8
Date : 01-01-2022, 02-01-2022, 03-01-2022
What’s the code you have used that resulted in an error message?
Regards,
Joachim
Sir i need answer f my both questions , Thanks
Hi again,
Could you please share the code you have tried yourself?
Regards,
Joachim