Max & Min by Group in Python (2 Examples)
In this article, I’ll demonstrate how to calculate maxima and minima by group in the Python programming language.
The article will contain two examples for the computation of maxima and minima by group. To be more specific, the page is structured as follows:
With that, let’s dive right in:
Example Data & Software Libraries
We first need to load the pandas library, to be able to apply the functions that are included in the library:
import pandas as pd # Load pandas library
We also need to construct some example data:
data = pd.DataFrame({'x1':[6, 5, 2, 8, 1, 6, 5, 8],  # Create pandas DataFrame
                     'x2':range(11, 19),
                     'group1':['C', 'B', 'B', 'A', 'C', 'A', 'B', 'A'],
                     'group2':['a', 'a', 'a', 'a', 'b', 'b', 'b', 'b']})
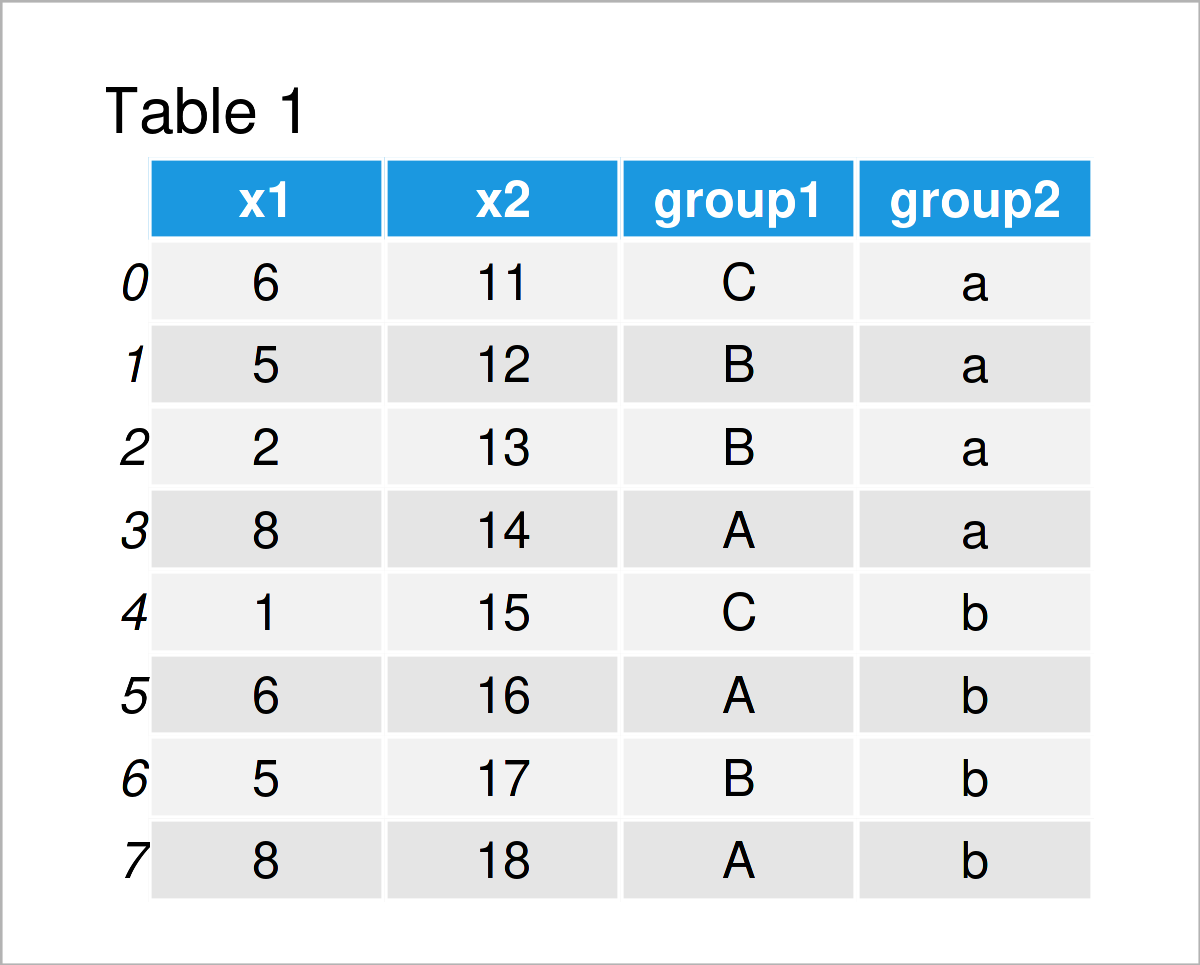
print(data)                                          # Print pandas DataFrame

Have a look at the previously shown table. It shows that our pandas DataFrame is composed of eight rows and four variables. The columns x1 and x2 contain float values, and the variables group1 and group2 will be used as group and subgroup indicators.
Example 1: Maximum & Minimum by Group in pandas DataFrame
In this example, I’ll show how to calculate maxima and minima by one grouping column in Python.
We can compute the max values by group as shown below…
print(data.groupby('group1').max())                  # Get max by group
#         x1  x2 group2
# group1
# A        8  18      b
# B        5  17      b
# C        6  15      b
…and the min values by group as illustrated by the following Python code:
print(data.groupby('group1').min())                  # Get min by group
#         x1  x2 group2
# group1
# A        6  14      a
# B        2  12      a
# C        1  11      a
Example 2: Maximum & Minimum by Group & Subgroup in pandas DataFrame
In this example, I’ll explain how to use multiple group columns to split our pandas DataFrame into subgroups for the calculation of maxima and minima.
For this, we have to specify a list of group indicators in the groupby column. The Python syntax below computes the maximum for each subgroup…
print(data.groupby(['group1', 'group2']).max())      # Get max by multiple groups
#                x1  x2
# group1 group2
# A      a        8  14
#        b        8  18
# B      a        5  13
#        b        5  17
# C      a        6  11
#        b        1  15
…and the following Python syntax calculates the subgroup minima:
print(data.groupby(['group1', 'group2']).min())      # Get min by multiple groups
#                x1  x2
# group1 group2
# A      a        8  14
#        b        6  16
# B      a        2  12
#        b        5  17
# C      a        6  11
#        b        1  15
Video & Further Resources
Would you like to learn more about the computation of maxima and minima by group? Then I recommend watching the following video on my YouTube channel. In the video, I’m explaining the topics of this tutorial:
Also, you may want to read some of the other tutorials on this homepage. Please find some articles below.
- Max & Min in Python
- Get Max & Min Value of Column & Index in pandas DataFrame
- Max & Min of NumPy Array in Python
- Summary Statistics of pandas DataFrame
- Basic Course for the pandas Library in Python
- Python Programming Language
You have learned on this page how to find maxima and minima by group in Python. In case you have any further questions, don’t hesitate to let me know in the comments section. Furthermore, don’t forget to subscribe to my email newsletter for updates on the newest articles.


