ggplot2 Title & Subtitle with Different Size and Color in R (2 Examples)
This article illustrates how to modify text sizes and colors of title and subtitle of a ggplot2 plot in R.
The content is structured as follows:
Sound good? Let’s jump right to the examples…
Example Data, Add-On Packages & Basic Graph
Consider the following example data:
data <- data.frame(x = 1:10,        # Example data
                   y = 1:10)
As you can see based on the previous output of the RStudio console, the example data consists of ten rows and two numeric columns.
If we want to draw our data with the ggplot2 package, we also have to install and load ggplot2:
install.packages("ggplot2")           # Install & load ggplot2 package
library("ggplot2")
Next, we can plot our data:
ggp <- ggplot(data, aes(x, y)) +    # Basic ggplot2 scatterplot
  geom_point() +
  labs(title = "My Title",
       subtitle = "My Subtitle")
ggp                                 # Print plot

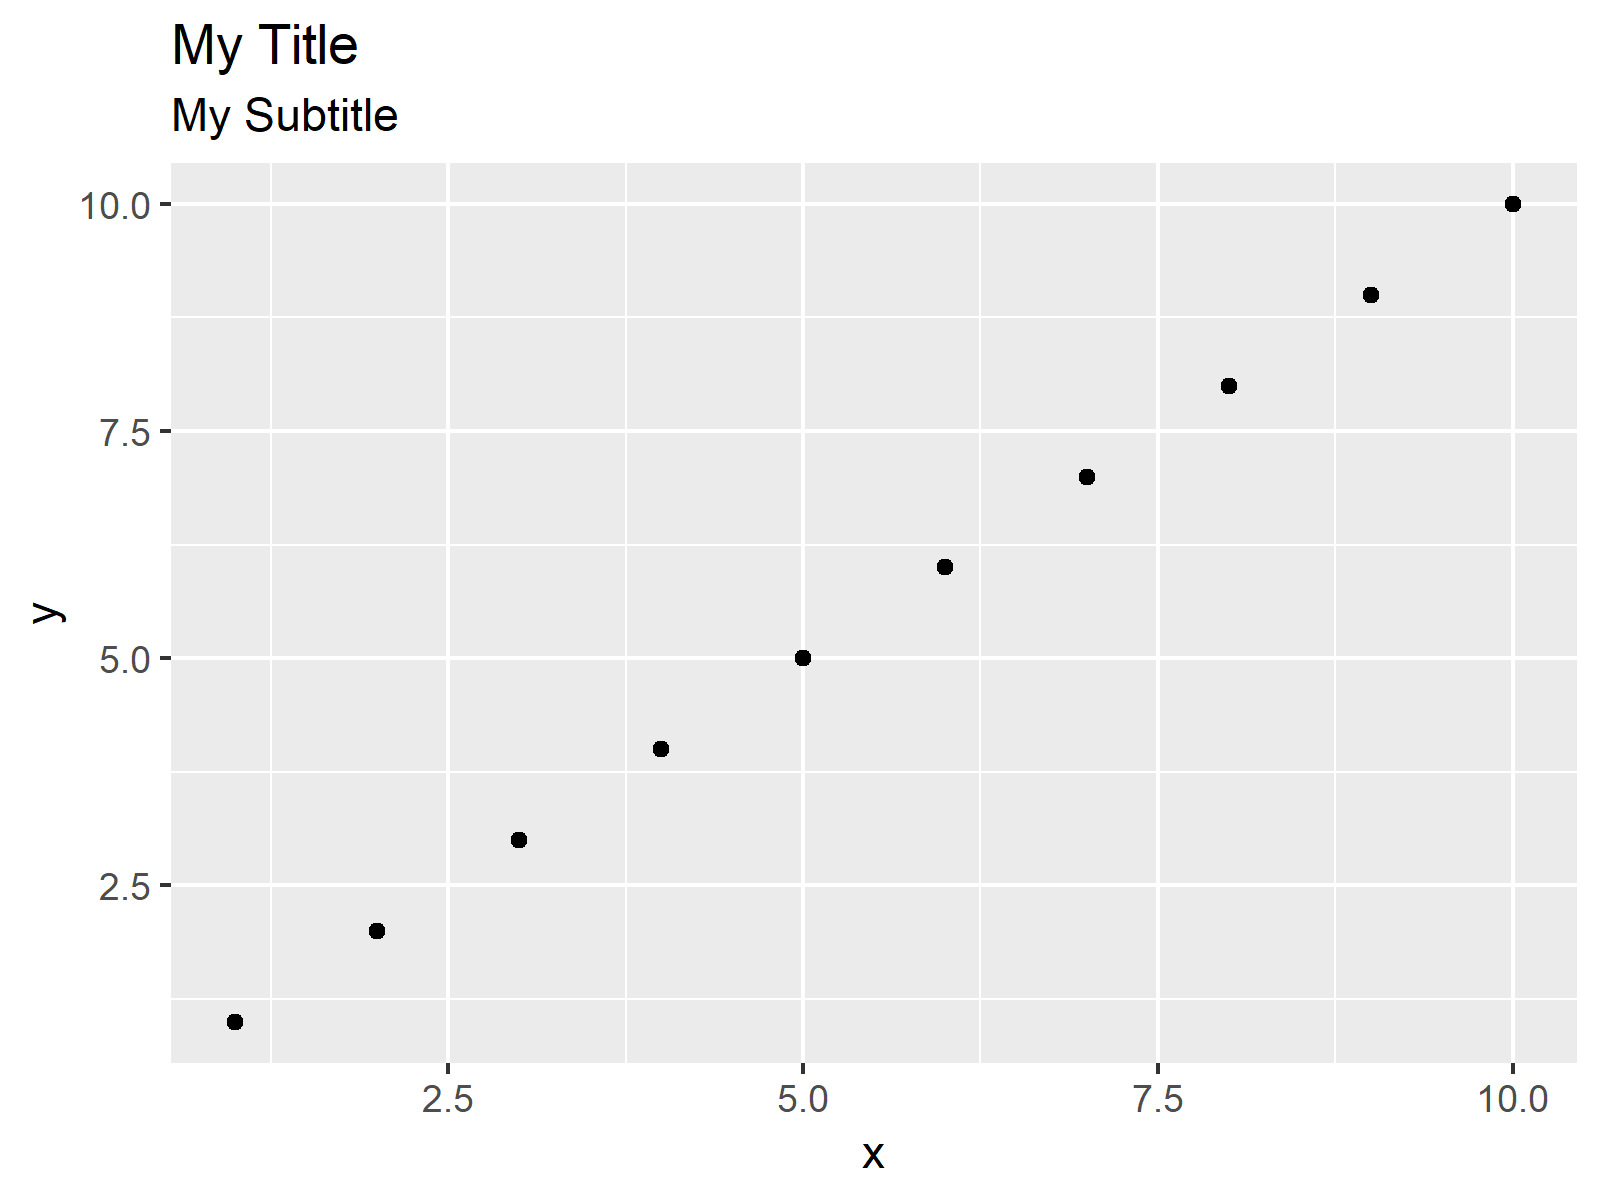
As shown in Figure 1, we created a scatterplot containing a title and a subtitle with the previous R code. However, both titles have the same size and the same color. Next, I’ll show how to change that!
Example 1: ggplot2 Title & Subtitle with Different Size
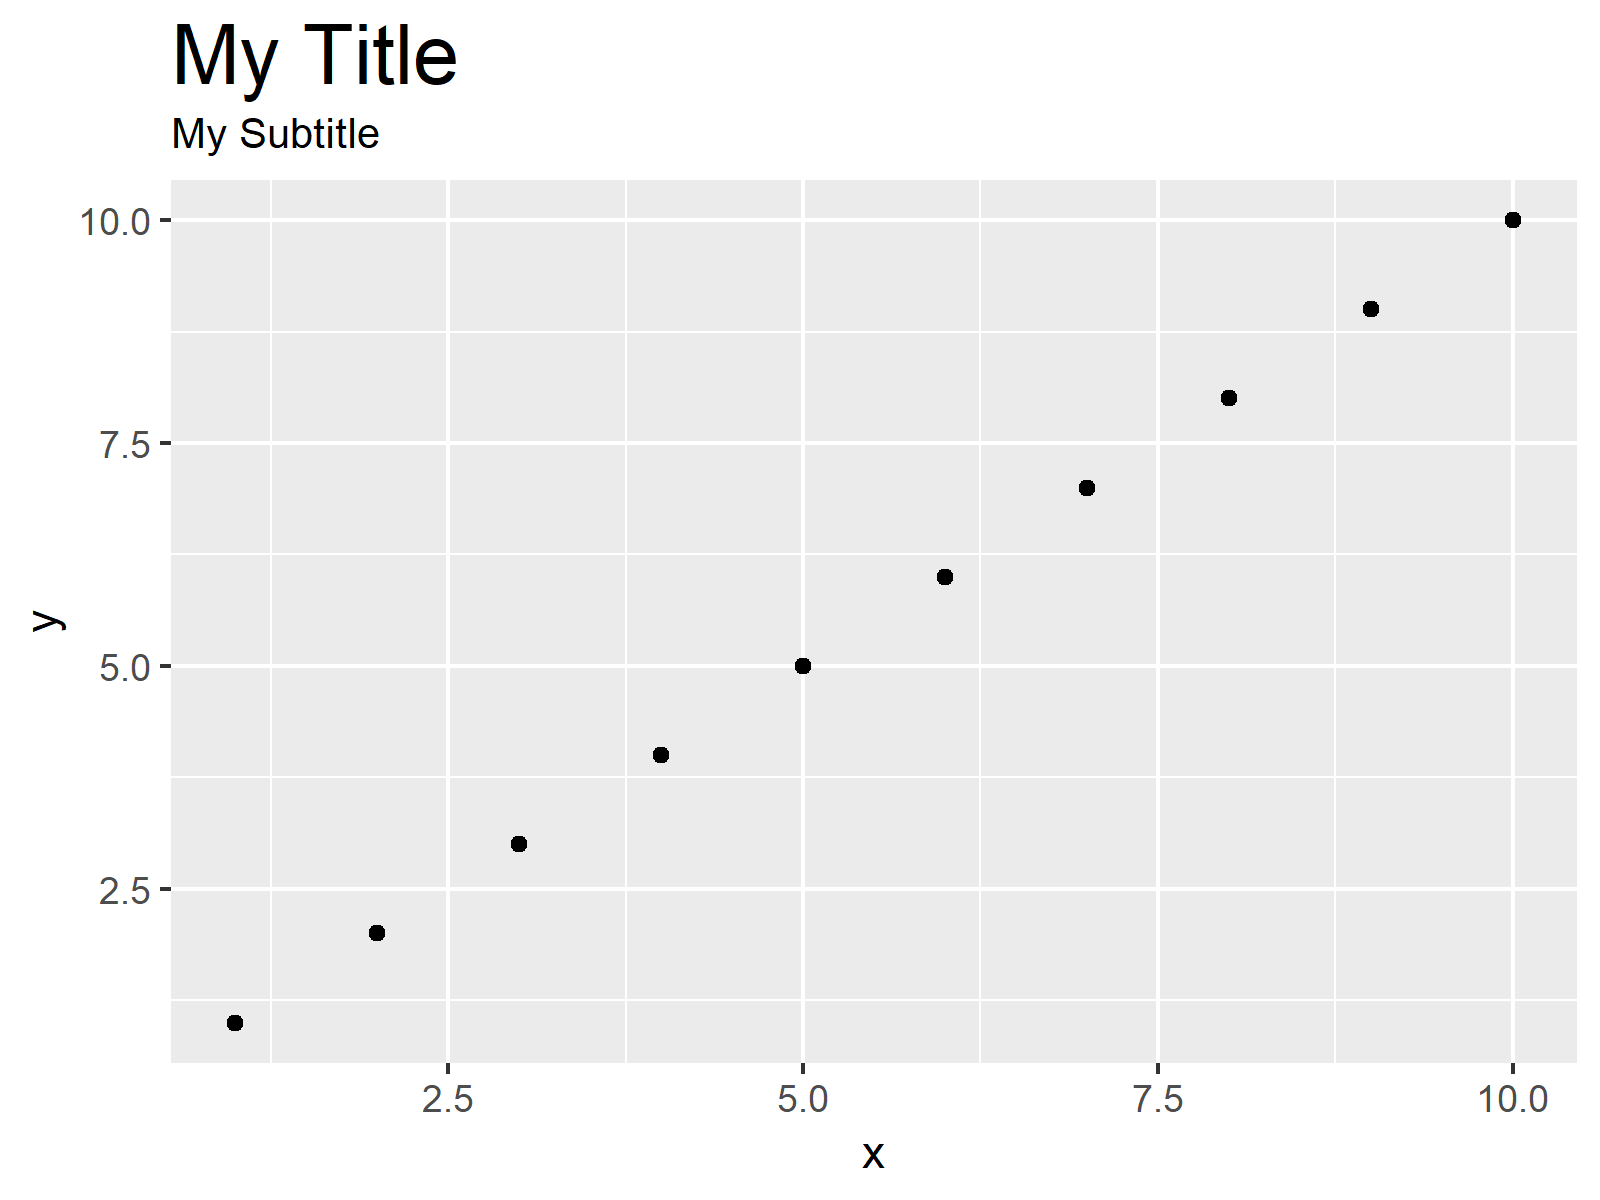
Example 1 illustrates how to increase or decrease the text size of our title and subtitle. The following R code sets the text size of the main title to 20 and the size of the subtitle to 10:
ggp +                               # Change sizes of title & subtitle
  theme(plot.title = element_text(size = 20),
        plot.subtitle = element_text(size = 10))

Figure 2 shows the output of the previous code – A ggplot2 graph with different text sizes of title and subtitle.
Example 2: ggplot2 Title & Subtitle with Different Size
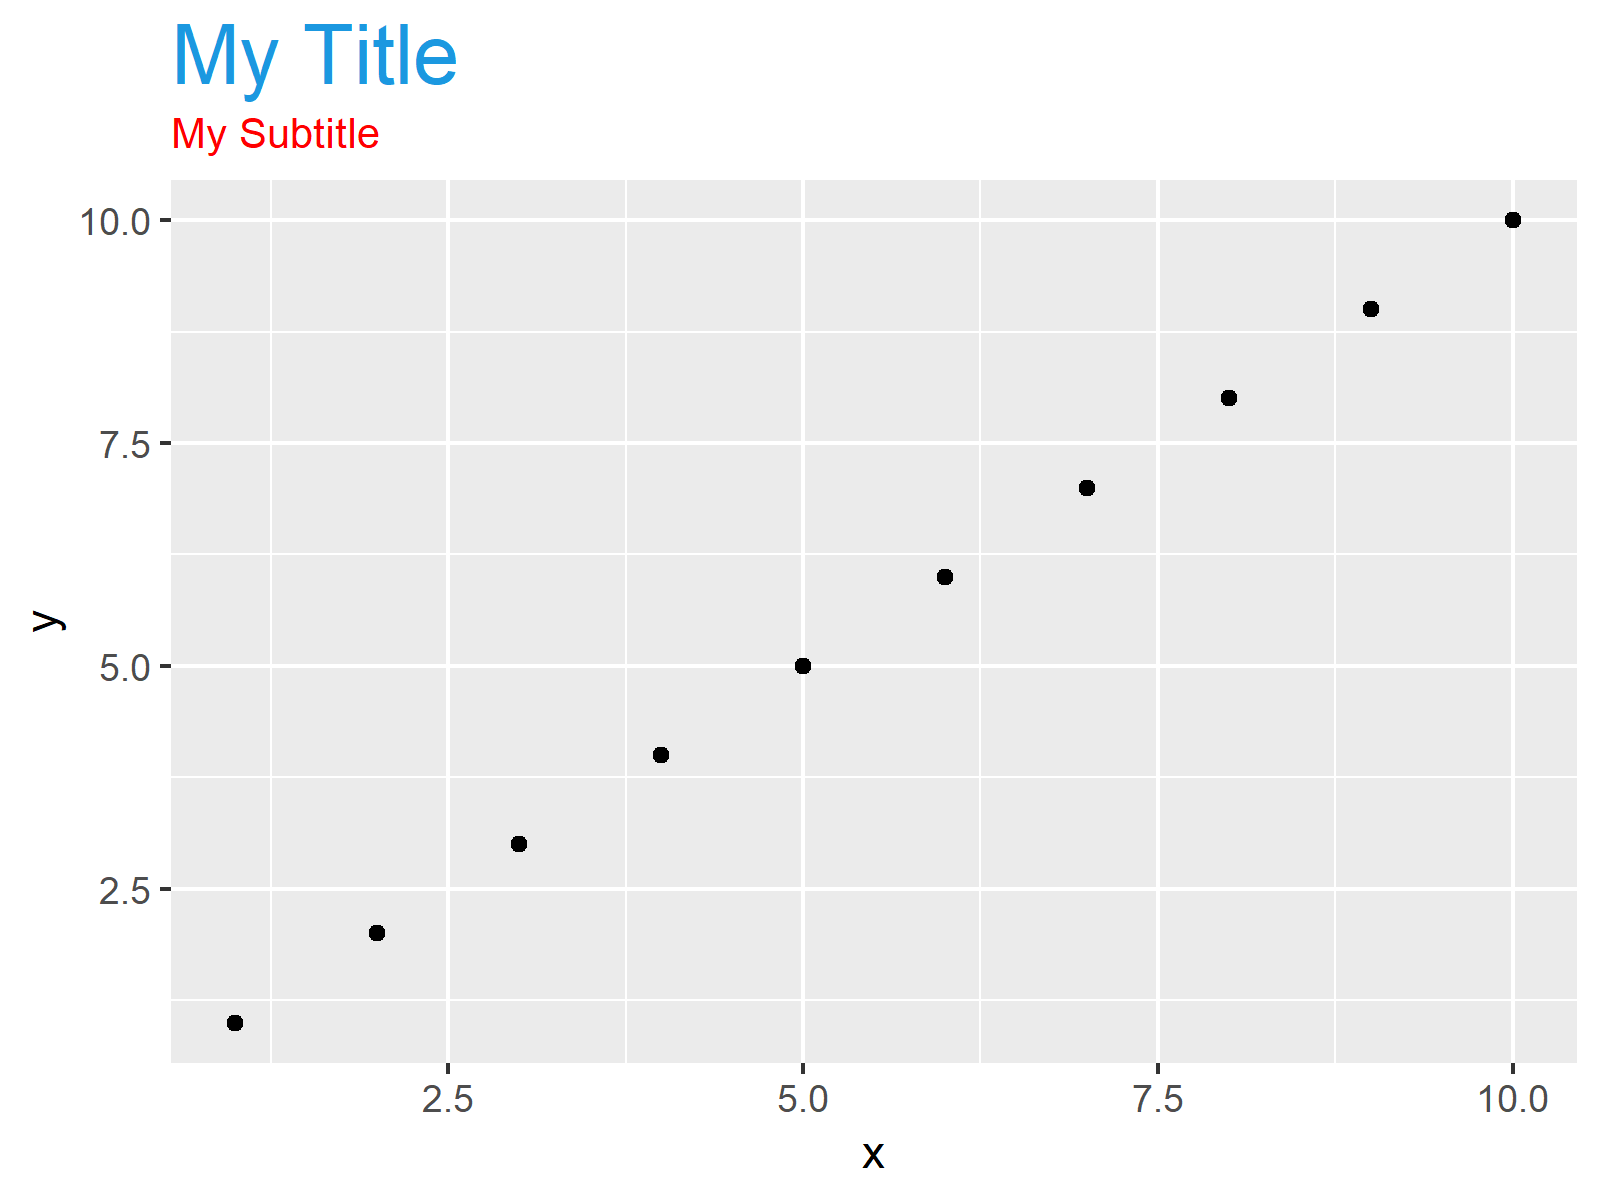
This Section shows how to manipulate the colors of our titles. As you can see in the following R syntax, we can either use a HEX-code or a predefined color name to change the colors of titles and subtitles.
ggp +                               # Change colors of title & subtitle
  theme(plot.title = element_text(size = 20, color = "#1b98e0"),
        plot.subtitle = element_text(size = 10, color = "red"))

The output of the previous R programming code is shown in Figure 3: The same plot as before but with blue and red title and subtitle.
Video, Further Resources & Summary
I have recently published a video on my YouTube channel, which illustrates the R programming syntax of this tutorial. Please find the video below:
In addition, you may want to read the other tutorials on this website. I have released numerous tutorials already:
- Create Color Range Between Two Colors in R
- Assign Fixed Colors to Categorical Variable in ggplot2 Plot
- Extract Default Colors of ggplot2 Package
- R Graphics Gallery
- The R Programming Language
To summarize: You learned in this article how to change size and color of ggplot2 titles in the R programming language. In case you have any further questions, please let me know in the comments.


