Export plotly Graph as PNG, JPEG & HTML File in R (Example)
This tutorial provides several examples to save or export plotly graphs in R.

Note: This article was created in collaboration with Kirby White. Kirby is a Statistics Globe author, innovation consultant, and data science instructor. His Ph.D. is in Industrial-Organizational Psychology. You can read more about Kirby here!
Packages & Example Data
If you have not already done so, install and load these packages:
We’ll use the mtcars dataset for this example, which is already included in R.
df <- datasets::mtcars
Let’s create a basic plotly scatterplot that we’ll store in an object called fig, which we’ll adjust throughout the tutorial to demonstrate the features:
fig <-
  df %>%
  plot_ly(
    x = ~disp,
    y = ~mpg,
    color = ~factor(cyl),
    type = "scatter",
    mode = "markers"
  )

fig #display the graph
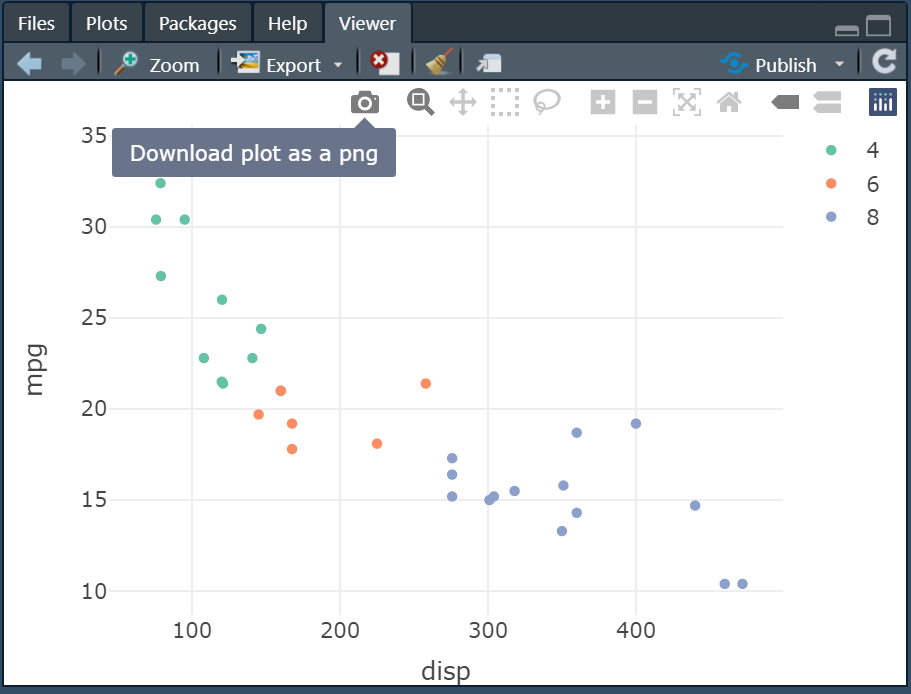
Perhaps the easiest way to write your graphic as a PNG file is to click the “download plot as PNG” button in the toolbar at the top of the graph. When a plotly graph is displayed (either in the viewer window of RStudio or on a webpage), you can hover your cursor over the top of the graph to find the button here:
If you are using RStudio, the “Export” menu will give you more control over the output file. If you select “Save an image…” you can specify the image type (i.e., png, jpeg) and size before saving.
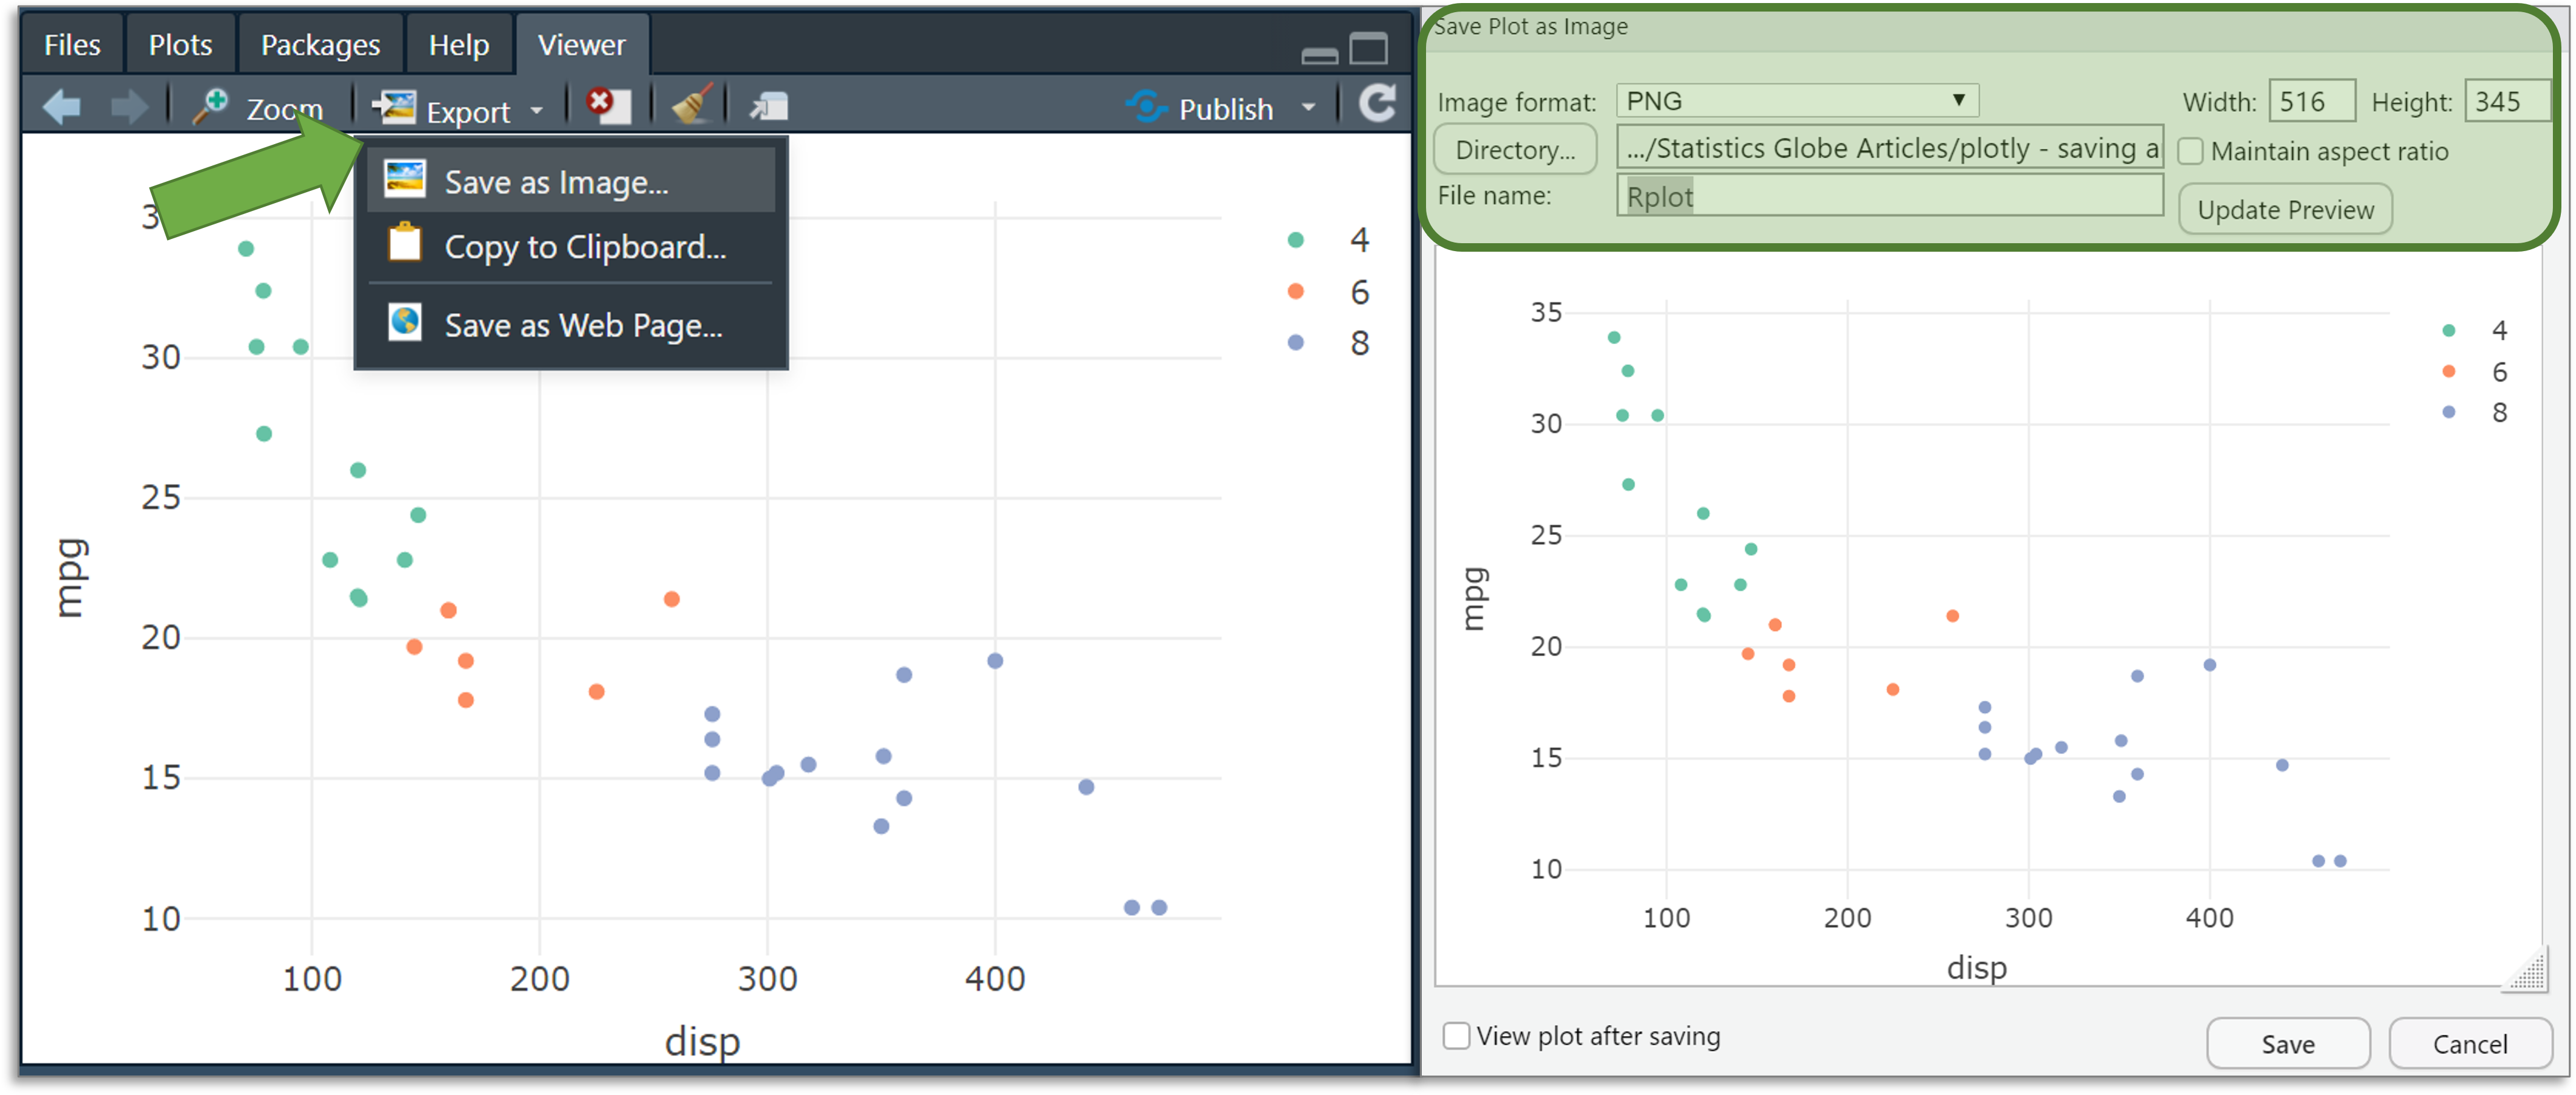
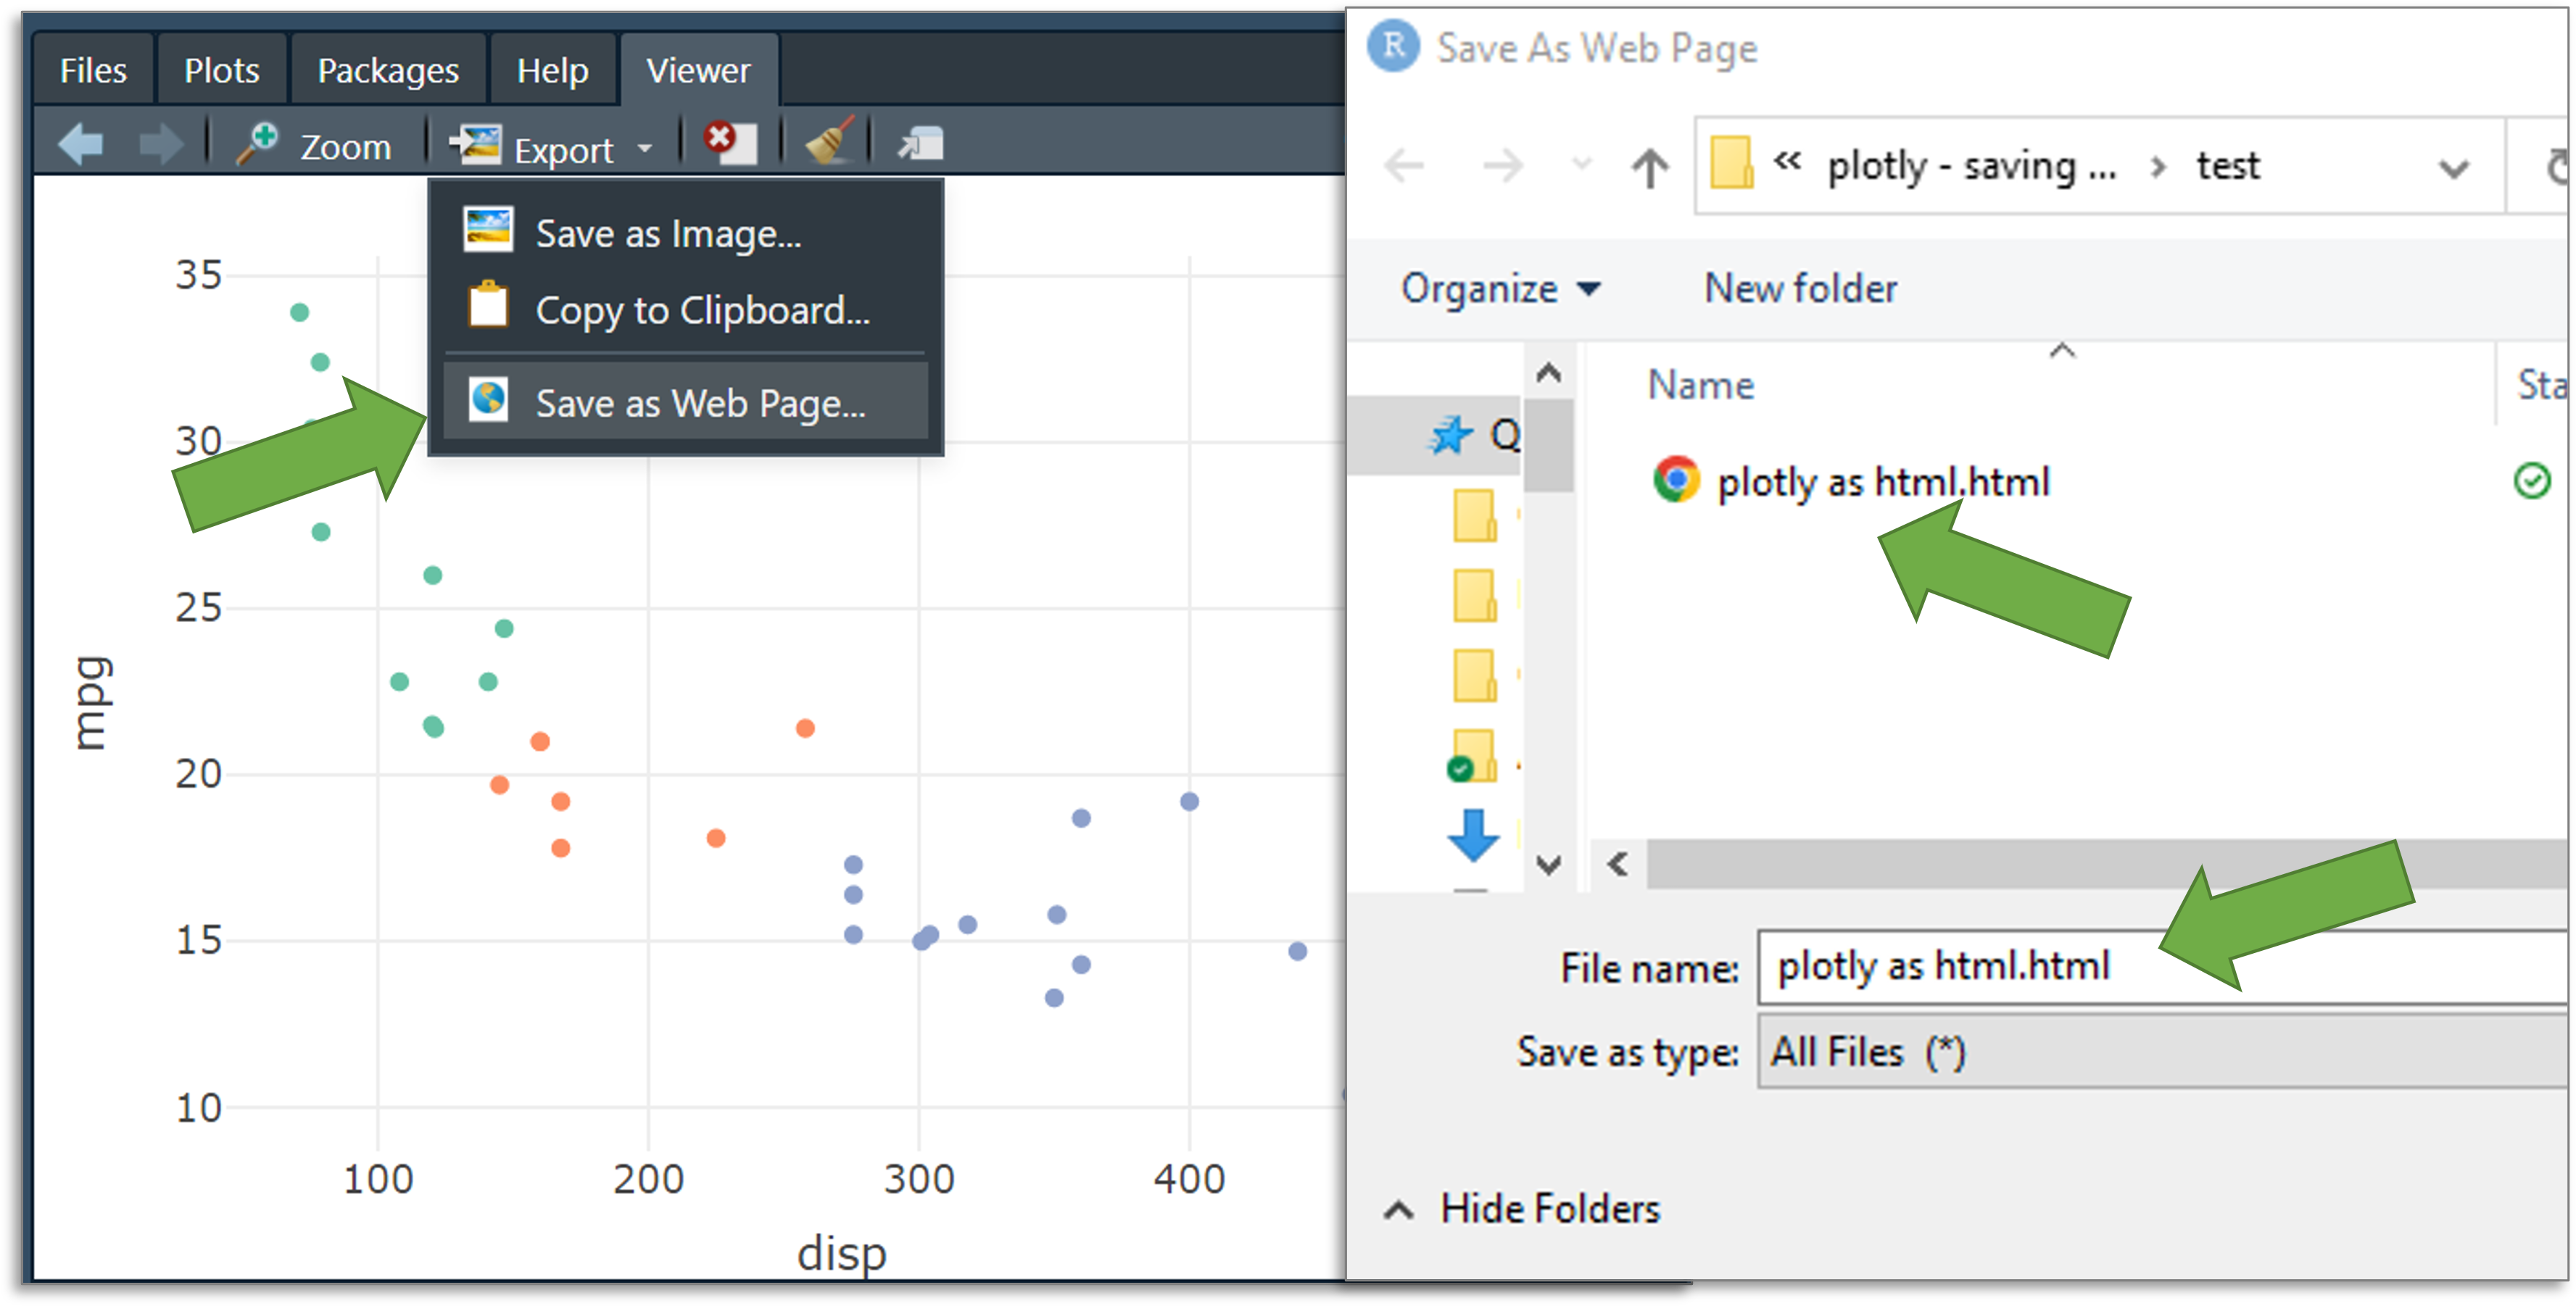
Both of these methods save a static image of the graph. That is, they don’t have any of the interactive features that make plotly so great! To retain those features, you can select the “Save as a web page…” option the Export menu. This will save the graphic as an html file. You can share these files with colleagues so that they can open it in a web browser and interact with the graphic.
Method 2: R Code
You can also save plotly graphics with R code. These methods can be integrated into a loop or other programmatic process to easily create multiple graphs at once.
The simplest method is to use the export function from the plotly package. You simply specify which graph to save (called fig in our example) and specify the file location, name, and type with the file argument.
This function can save plotly graphs as .png, .jpeg, .webp, .svg, and .pdf.
It will save the file in your working directory, or you can specify a different file path with the file argument.
plotly::export(p = fig, #the graph to export
               file = "graph 1.png") #the name and type of file (can be .png, .jpeg, etc.)
To save the graphic as an html file, you’ll need the htmlwidgets package.
From there, you can use the saveWidget function to output an html file.
htmlwidgets::saveWidget(
                widget = fig, #the plotly object
                file = "figure.html", #the path & file name
                selfcontained = TRUE #creates a single html file
                )
Further Resources
In case you would like to learn more on the plotly package in R, make sure to check out our introduction to plotly video:
You can also check out these other articles for more detailed examples and videos of these popular charts in plotly:
- Introduction to the plotly Package in R
- plotly Line Plot in R
- plotly Scatterplot in R
- plotly Barplot in R
- plotly Boxplot in R
- plotly Histograms in R

I’m Joachim Schork. On this website, I provide statistics tutorials as well as code in Python and R programming.
Statistics Globe Newsletter
Get regular updates on the latest tutorials, offers & news at Statistics Globe. I hate spam & you may opt out anytime: Privacy Policy.