Draw Multiple lattice Plots in One Window in R (Example)
This article illustrates how to plot several lattice graphics in one grid of plots in the R programming language.
Table of contents:
Let’s dig in:
Creation of Exemplifying Data
The following data will be used as basement for this R programming tutorial:
set.seed(723645)                                   # Create example data
data <- data.frame(x = rnorm(500),
                   y = rnorm(500),
                   group = c(rep("A", 250),
                             rep("B", 250)))
head(data)                                         # Head of example data
#            x           y group
# 1 -2.4512682  1.22588856     A
# 2 -1.0782307 -0.22679003     A
# 3  0.1720944  0.05254144     A
# 4  0.4277141  2.04637615     A
# 5  0.1649821 -0.49608600     A
# 6 -1.0664125 -0.94850249     A
The previous output of the RStudio console shows that our example data has three columns. The variables x and y contain numeric data and the variable group is a grouping indicator.
Example: Drawing Grid of lattice Plots Using gridExtra Package
This Example shows how to use the gridExtra package to create a grid of lattice plots in R. First, we have to install and load the lattice package:
install.packages("lattice")                        # Install lattice package
library("lattice")                                 # Load lattice package
Now, we can create two lattice plots as shown below. Note that we are saving our plots in two data objects called plat1 and plat2.
plat1 <- xyplot(y ~ x, data[data$group == "A", ])  # Create plots
plat2 <- xyplot(y ~ x, data[data$group == "B", ])
If we want to draw these lattice plots in a grid, we need to install and load the gridExtra package:
install.packages("gridExtra")                      # Install gridExtra package
library("gridExtra")                               # Load gridExtra package
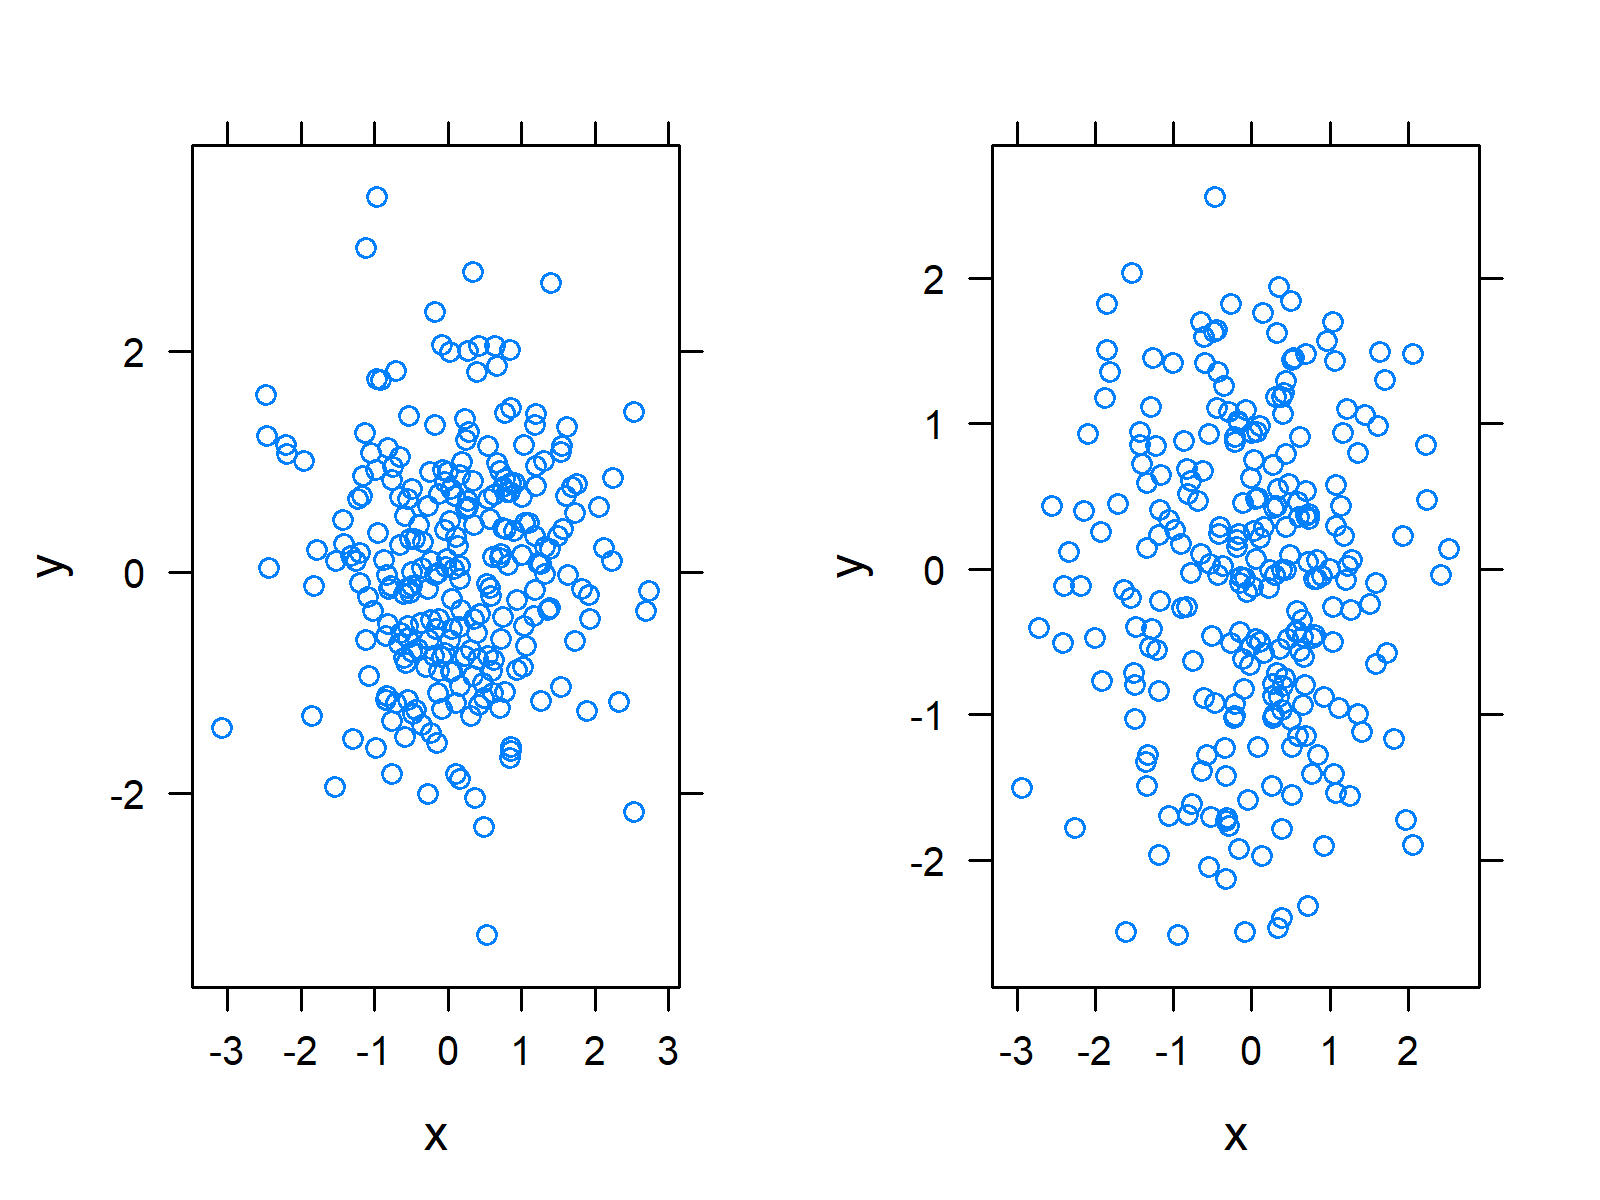
Next, we can use the grid.arrange function, which is provided by the gridExtra package, to draw multiple lattice graphs in the same window:
grid.arrange(plat1, plat2, ncol = 2) # Apply grid.arrange

As shown in Figure 1, the previous R code created a grid of scatterplots created with the lattice package.
Video, Further Resources & Summary
Would you like to learn more about plotting data with lattice? Then you may watch the following video of my YouTube channel. I illustrate the contents of this tutorial in the video.
Besides the video, you may want to read the other articles on https://www.statisticsglobe.com/. Some other articles can be found below.
In summary: At this point you should have learned how to draw multiple lattice plots in the same grid of plots in R. Let me know in the comments, if you have further questions. In addition, don’t forget to subscribe to my email newsletter to get updates on new tutorials.


2 Comments. Leave new
Thanks so much … i need to buy you coffee for this !!!
Hey, thank you very much for the positive feedback! That would be nice, coffee is always welcome here in the office 🙂
Best,
Matthias