Draw Disproportionate Sample from Data Frame in R (Example)
This article demonstrates how to draw a sample with different probabilities by group in R programming.
Table of contents:
Let’s dig in…
Creation of Example Data
First, we’ll need to define some data that we can use in the following examples:
data <- data.frame(value = 1:50,                             # Create example data frame
                   group = rep(letters[1:5], each = 10))
head(data)                                                   # Head of example data frame

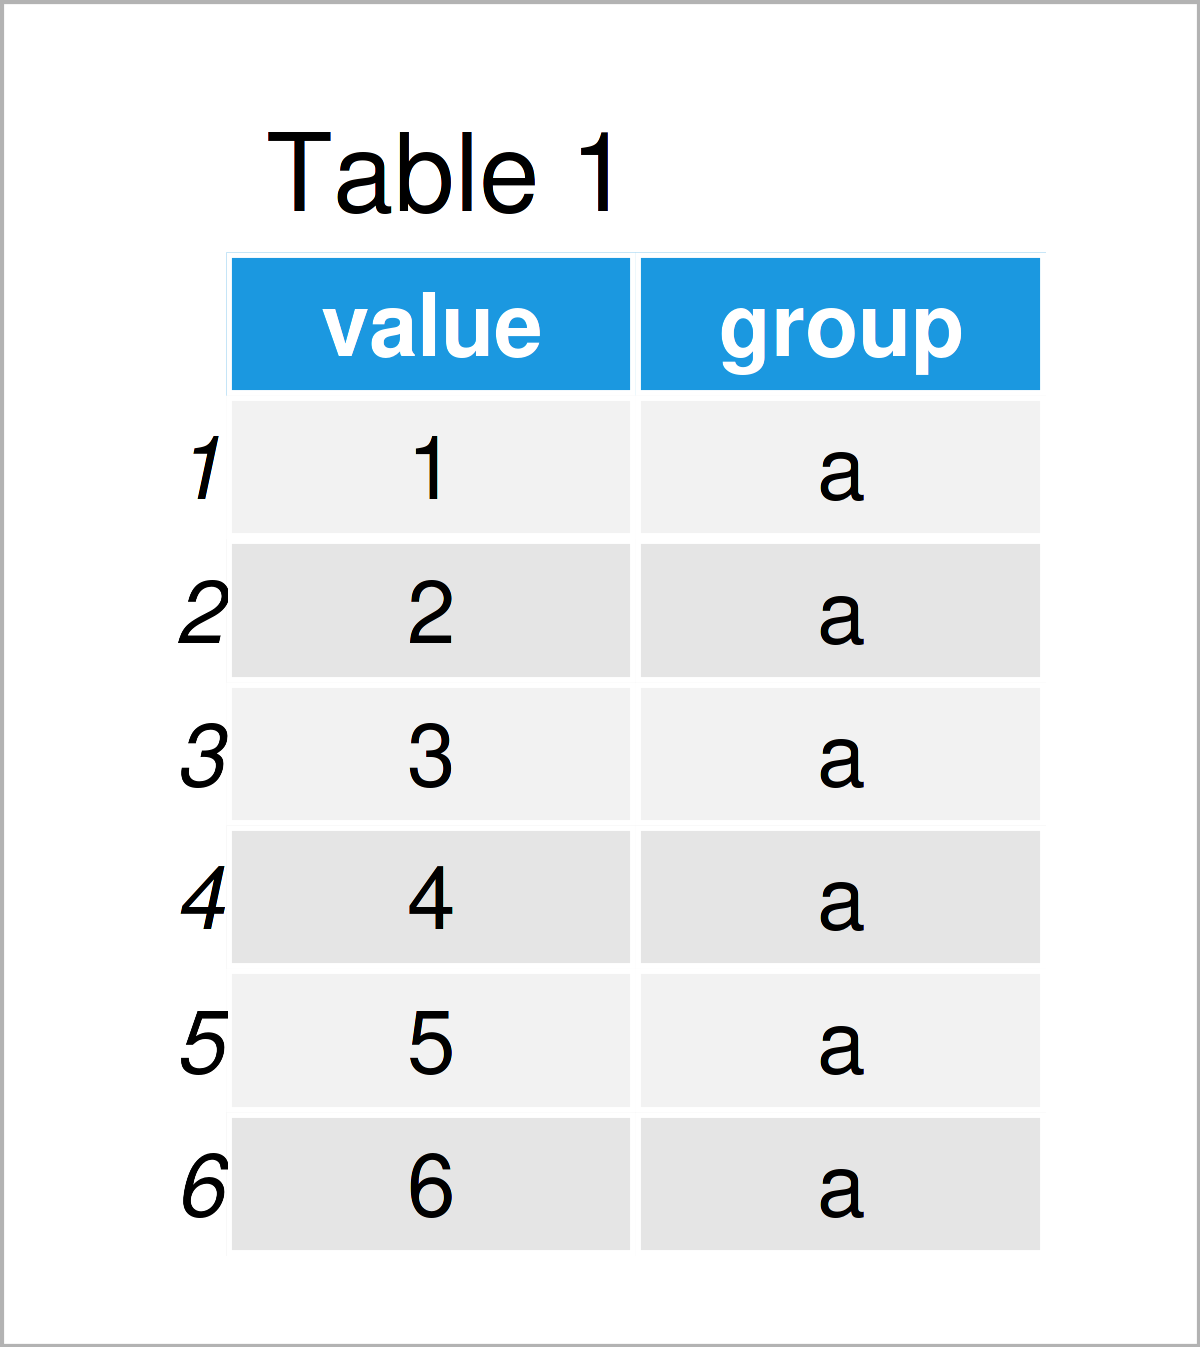
Table 1 shows that our example data is composed of two columns called “value” and “group”. The variable value is an integer and the column group is a character.
Example: Create Random Sample of Data Frame with Multiple Probabilities
In this example, I’ll explain how to create a random subsample of a data frame with different sampling probabilities by group.
To achieve this, we first have to specify a vector of probabilities that has the same length as the number of rows in our data frame:
my_prob <- rep(NA, 50)                                       # Create vector of probabilities
my_prob[data$group == "a" | data$group == "b"] <- 0.05
my_prob[data$group == "c" | data$group == "d"] <- 0.1
my_prob[data$group == "e"] <- 0.7
my_prob                                                      # Print vector of probabilities
#  [1] 0.05 0.05 0.05 0.05 0.05 0.05 0.05 0.05 0.05 0.05 0.05 0.05 0.05 0.05 0.05
# [16] 0.05 0.05 0.05 0.05 0.05 0.10 0.10 0.10 0.10 0.10 0.10 0.10 0.10 0.10 0.10
# [31] 0.10 0.10 0.10 0.10 0.10 0.10 0.10 0.10 0.10 0.10 0.70 0.70 0.70 0.70 0.70
# [46] 0.70 0.70 0.70 0.70 0.70
As you can see based on the previous output of the RStudio console, our vector of probabilities contains 50 values.
We have specified that we want to draw rows of the groups a and b with a probability of 5%, rows of the groups c and d with a likelihood of 10%, and rows of the group e with a probability of 70%.
In other words: the probabilities to draw a group are disproportionate.
Next, we should specify a random seed to make the following data sampling process reproducible:
set.seed(239678564) # Set random seed
Now, we can apply the sample function to generate a random subsample of our data frame. Note that we are specifying the prob argument to be equal to the vector of probabilities that we have created before:
data_samp <- data[sample(nrow(data), 10, prob = my_prob), ]  # Draw sample of data frame
data_samp                                                    # Print sample of data frame

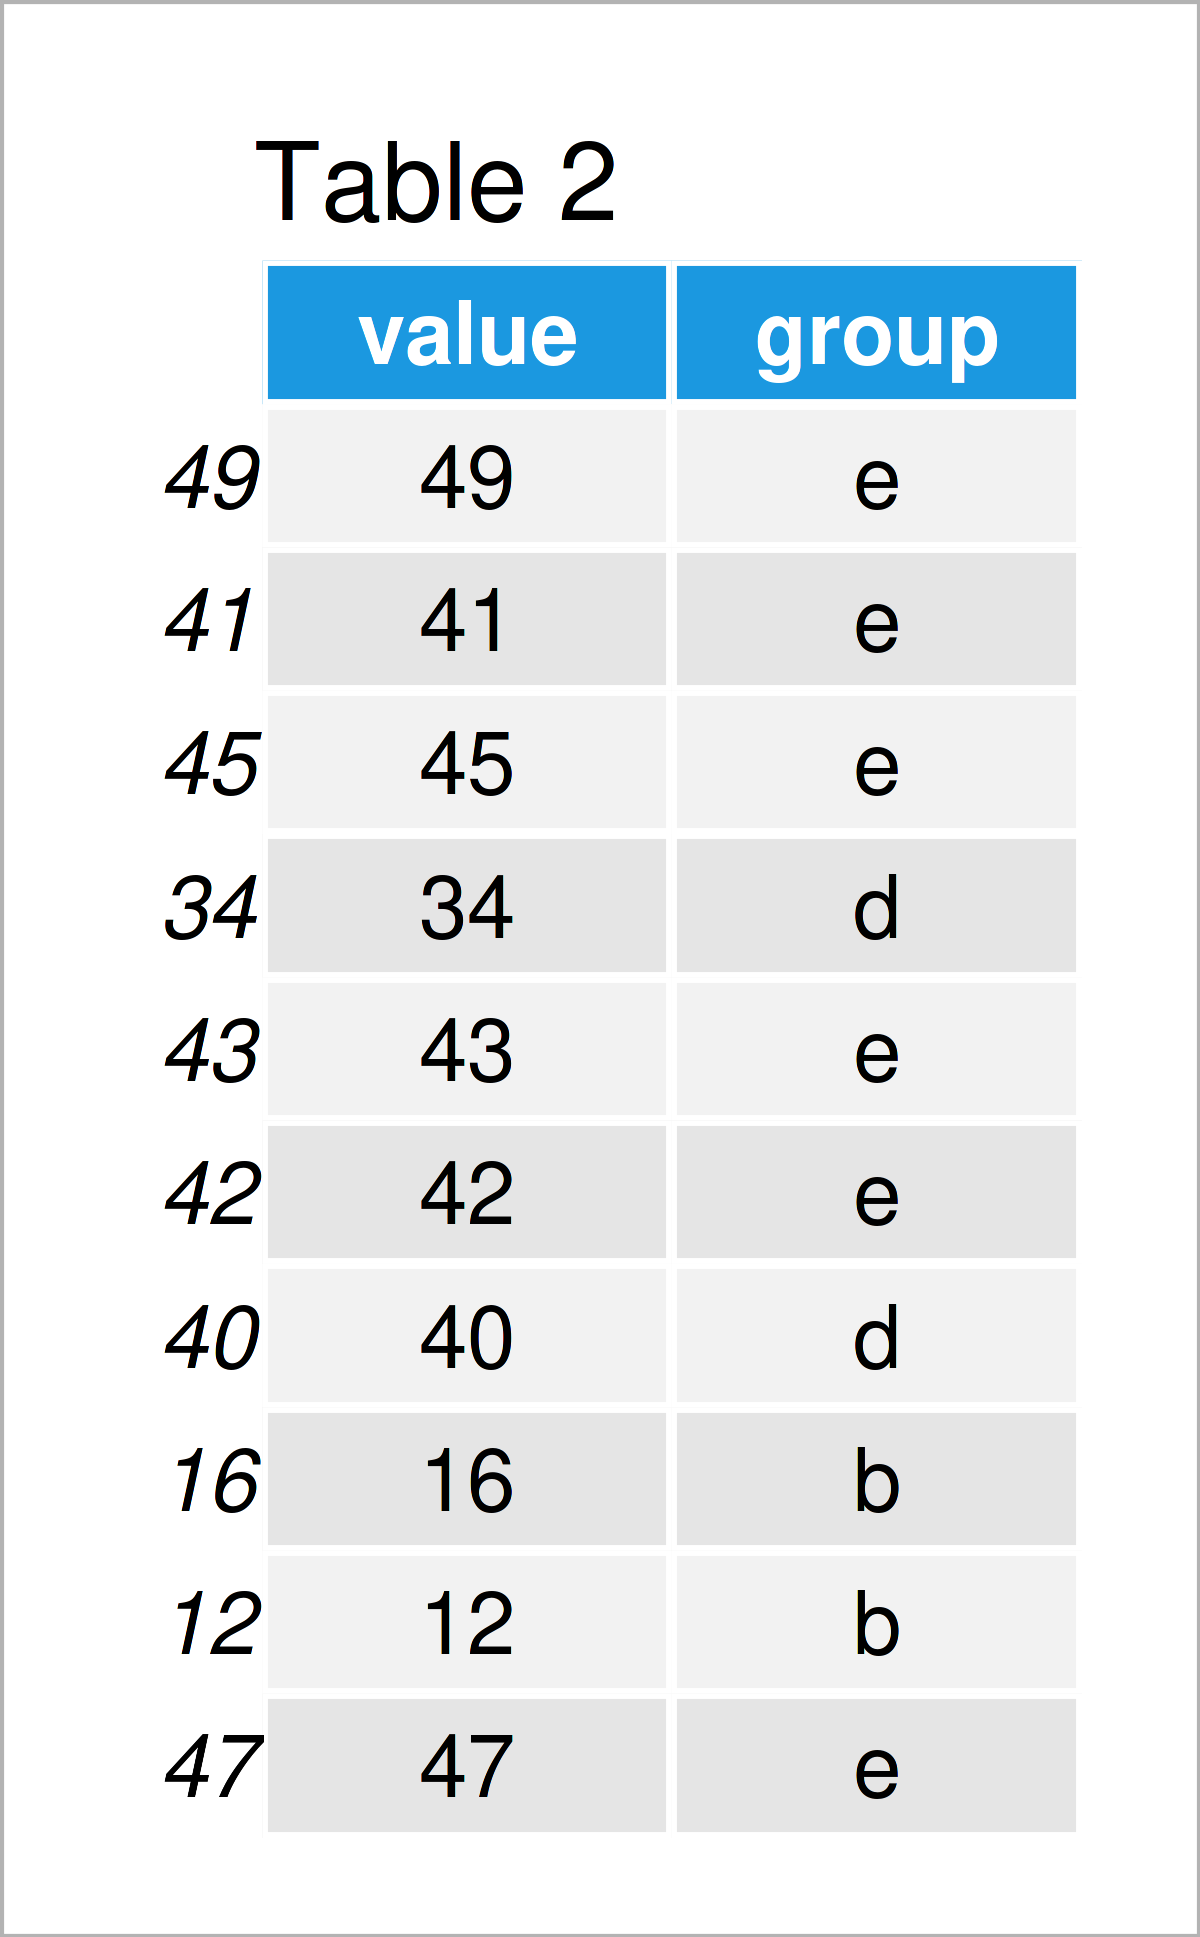
After executing the previous code the data frame subsample shown in Table 2 has been created.
As you can see, the group e was drawn the most often, since it had the highest chance of being drawn (i.e. 70%). In contrast, the groups a and c have not been selected at all.
Note that we have generated our sample without replacement. In case you want to draw a sample with replacement, you may specify the replace argument within the sample function to be equal to TRUE.
Video, Further Resources & Summary
I have recently released a video on my YouTube channel, which illustrates the contents of this tutorial. You can find the video instruction below:
Additionally, you might want to have a look at some other tutorials on my website. A selection of articles that are related to the creation of a sample with multiple probabilities by group can be found below:
- Sample Random Rows of Data Frame (Base R vs. dplyr Package)
- sample Function in R
- sample_n & sample_frac R Functions
- Draw ggplot2 Plot of Data Frame Subset
- Random Numbers in R
- R Programming Tutorials
In this R tutorial you have learned how to take a random sample with multiple disproportionate probabilities. Let me know in the comments section, if you have any additional questions or comments.


2 Comments. Leave new
We love you just know that we love you and this page is eveyrthing I need
Wow, thank you so much for the kind words Andrés! Great to hear that you find it useful! 🙂
Regards,
Joachim