data.frame Function in R (4 Examples)
In this post, I’ll explain how to apply the data.frame function in the R programming language.
Table of contents:
Let’s jump right to the examples!
Example 1: How to Create a Data Frame Using the data.frame() Function
Example 1 illustrates how to create new data frames by applying the data.frame function.
In this example, we are using the default settings of the data.frame function. For that reason, we only have to specify the column names and the values that we want to store in our data frame.
Consider the R syntax below:
data1 <- data.frame(x1 = 1:5,     # Create data frame with default settings
                    x2 = letters[1:5],
                    x3 = c(7, 3, 8, 7, 1),
                    x4 = "xXx")
data1                             # Print data frame
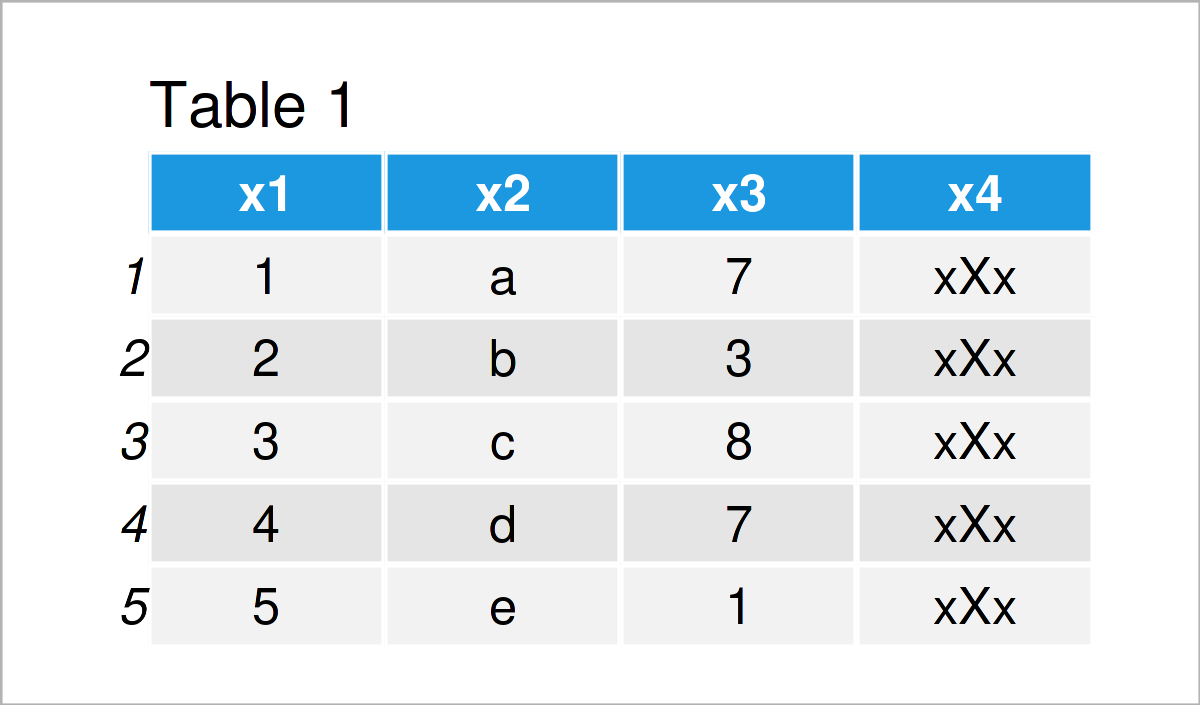
Table 1 shows the output of the previous R programming syntax: We have created a new data frame called data1 that contains five rows and the four columns x1, x2, x3, and x4.
As you can see, some of our columns contain numeric values, and other columns contain characters.
By having a closer look at the previous syntax you can also see that we have created each variable differently.
The columns x1 and x2 are based on numeric and character sequences, the column x3 is based on a vector constructed by the c() function, and the column x4 is based on a single character string the got repeated in each row of the data frame.
Example 2: Change Row Names when Creating a Data Frame
In Example 1, we have used the default settings to create our data frame. However, the data.frame function provides several optional arguments that we can manually change.
This example demonstrates how to set the row names of our data frame manually using the row.names argument of the data.frame function.
Have a look at the following R code and its output:
data2 <- data.frame(x1 = 1:5,     # Create data frame with different row names
                    x2 = letters[1:5],
                    x3 = c(7, 3, 8, 7, 1),
                    x4 = "xXx",
                    row.names = paste0("row_", LETTERS[1:5]))
data2                             # Print data frame
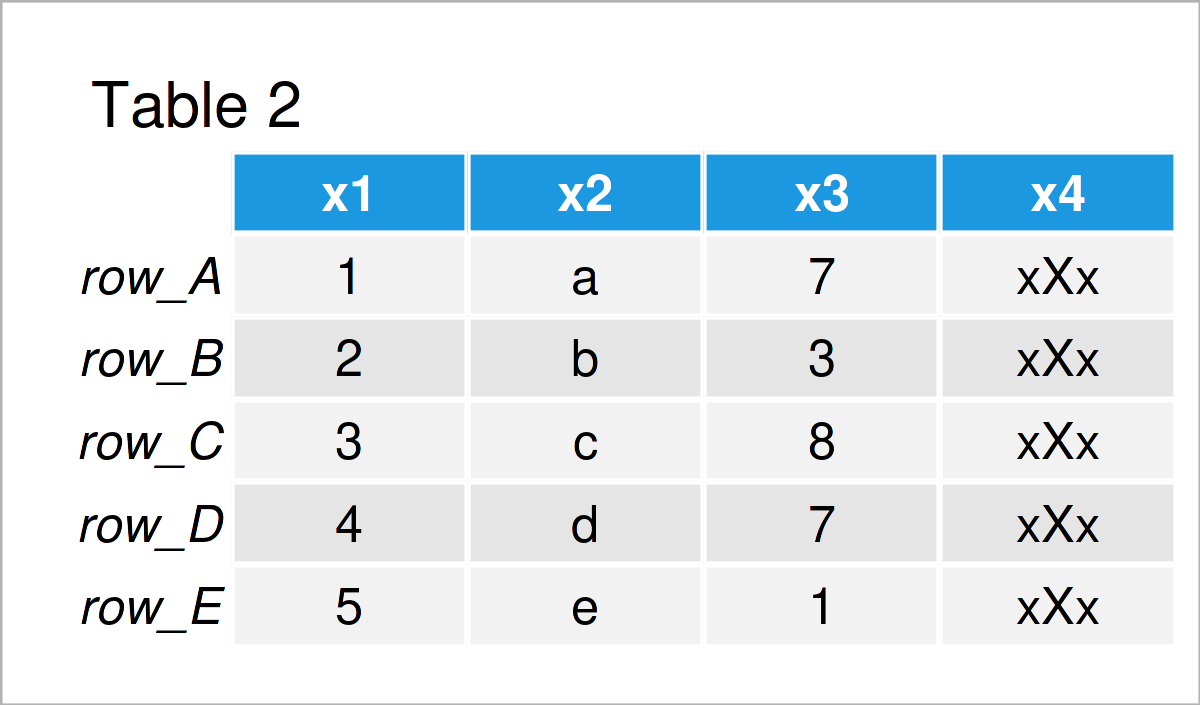
As shown in Table 2, the previous R programming syntax has created a new data frame with user-defined row names.
Example 3: Convert Characters to Factors when Creating a Data Frame
Another argument of the data.frame function is the stringsAsFactors argument. This argument can be used to automatically convert all character variables to the factor class.
To accomplish this, we have to set the stringsAsFactors argument to be equal to TRUE. Note that this was the default setting in earlier R versions. However, nowadays we have to choose this setting manually.
data3 <- data.frame(x1 = 1:5,     # Convert characters to factors in data frame
                    x2 = letters[1:5],
                    x3 = c(7, 3, 8, 7, 1),
                    x4 = "xXx",
                    stringsAsFactors = TRUE)
data3                             # Print data frame
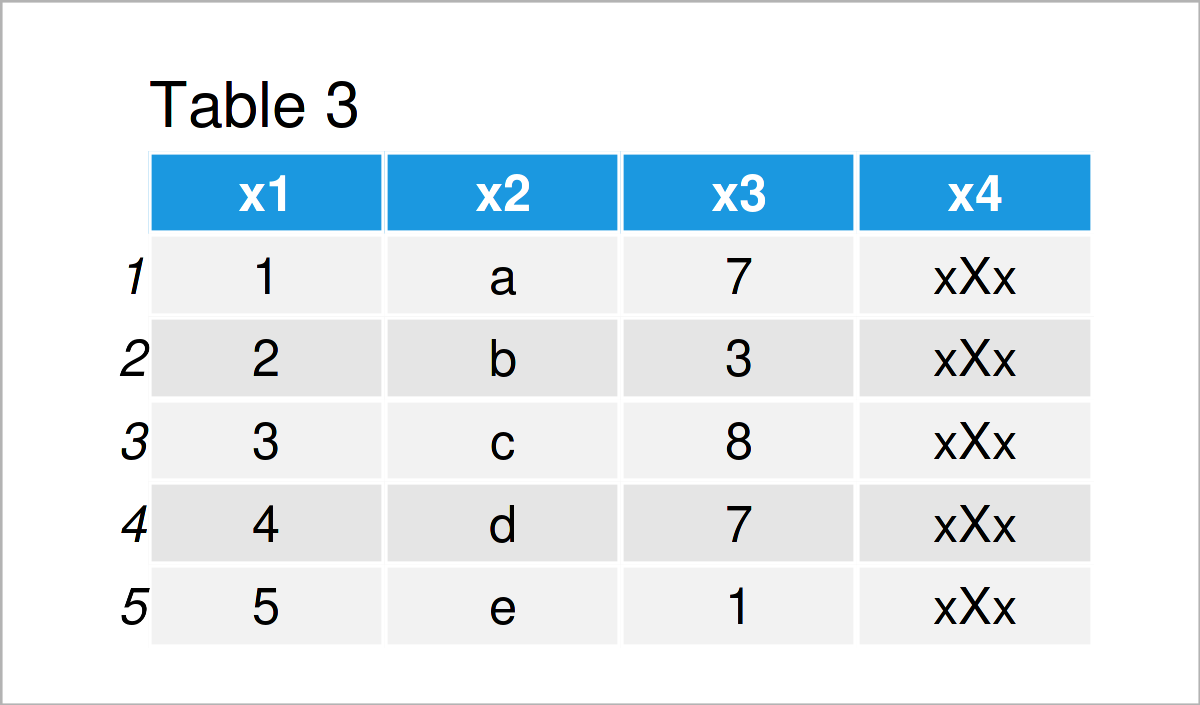
After running the previous R programming syntax the new data frame shown in Table 3 has been created. At this point, you might not see a difference compared to the data frame that we have created in the first example.
However, we can see the crucial difference by checking the classes of the columns of our data frame. We can do that based on the sapply and class functions as shown below:
sapply(data3, class)              # Check classes of data frame columns
#        x1        x2        x3        x4
# "integer"  "factor" "numeric"  "factor"
As you can see, both character variables (i.e. x2 and x4) have been transformed to the factor class.
Example 4: Convert a Matrix to a Data Frame Using the data.frame() Function
Until now, we have created new data frame objects. However, it’s also possible to convert other data objects to the data.frame class using the data.frame function.
In this specific example, we are going to change a matrix to a data frame. First, we have to create an example matrix:
mat1 <- matrix(0:11, nrow = 4)    # Create matrix
mat1                              # Print matrix
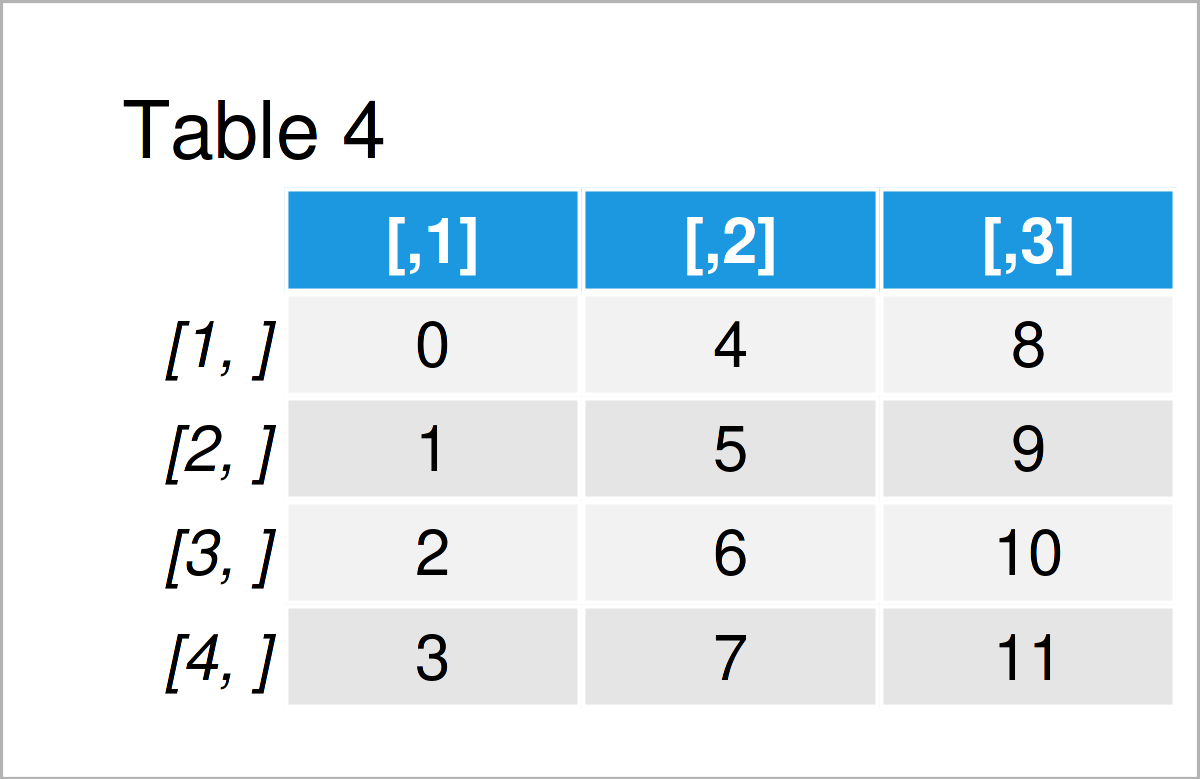
By running the previous syntax, we have created Table 4, i.e. a matrix containing four rows and three columns.
Next, we can apply the data.frame function to this matrix to switch its class to the data.frame class:
data4 <- data.frame(mat1)         # Convert matrix to data frame
data4                             # Print data frame
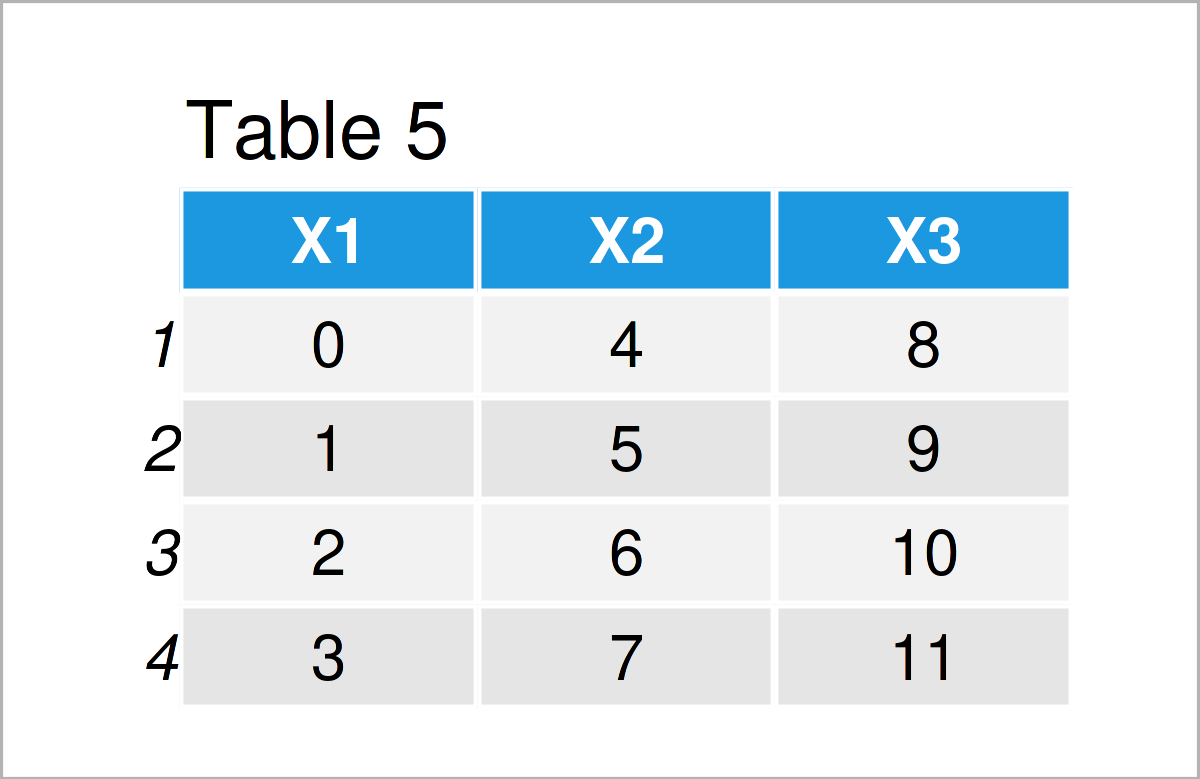
The output of the previous R syntax is shown in Table 5: A new data frame created from a matrix object.
Video & Further Resources
Have a look at the following video on my YouTube channel. In the video, I show the R code of the present article.
Additionally, you could read some of the other articles on this website.
- Difference Between data.frame & as.data.frame Functions
- is.data.frame & as.data.frame Functions in R
- Apply Function to Each Cell of Data Frame in R
- Change Classes of Data Frame Columns Automatically
- Replace Entire Data Frame Column in R
- Built-in R Commands (+ Examples)
- All R Programming Tutorials
In this R tutorial you have learned how to create data frames using the data.frame function. Don’t hesitate to let me know in the comments below, if you have additional questions.


