Cumulative Mean in R (3 Examples)
In this article, I’ll show how to compute the cumulative average in the R programming language.
The tutorial consists of the following information:
It’s time to dive into the exemplifying R code:
Creation of Example Data
The first step is to create some example data:
x <- c(5, 5, 1, 3, 9, 2)                  # Create example data
x                                         # Print example data
# [1] 5 5 1 3 9 2
The previous output of the RStudio console shows that our example data is a numeric vector with a length of six.
Example 1: Calculate Cumulative Mean Using cumsum() & seq_along() Functions
Example 1 shows how to get the cumulative mean of our example vector using the cumsum and seq_along functions provided by the basic installation of the R programming language.
Have a look at the following R code and its output:
x_cm1 <- cumsum(x) / seq_along(x)         # Apply cumsum & seq_along
x_cm1                                     # Print cumulative mean
# [1] 5.000000 5.000000 3.666667 3.500000 4.600000 4.166667
As you can see, we have created a new vector object called x_cm1 that consists of six numeric values. Each of these values is the cumulative mean corresponding to the elements of our input vector.
Example 2: Calculate Cumulative Mean Using cummean() Function of dplyr Package
In Example 2, I’ll explain how to use the cummean function of the dplyr package to compute the cumulative average of a numeric vector.
We first need to install and load the dplyr package to R, if we want to use the functions that are contained in the package:
install.packages("dplyr")                 # Install dplyr package
library("dplyr")                          # Load dplyr
Next, we can apply the cummean function to create a new vector of cumulative averages:
x_cm2 <- cummean(x)                       # Apply cummean
x_cm2                                     # Print cumulative mean
# [1] 5.000000 5.000000 3.666667 3.500000 4.600000 4.166667
The previous R code has created another vector object called x_cm2 that contains exactly the same output as Example 1. However, this time we have used the cummean function of the dplyr package.
Example 3: Add Cumulative Mean as Column to Data Frame
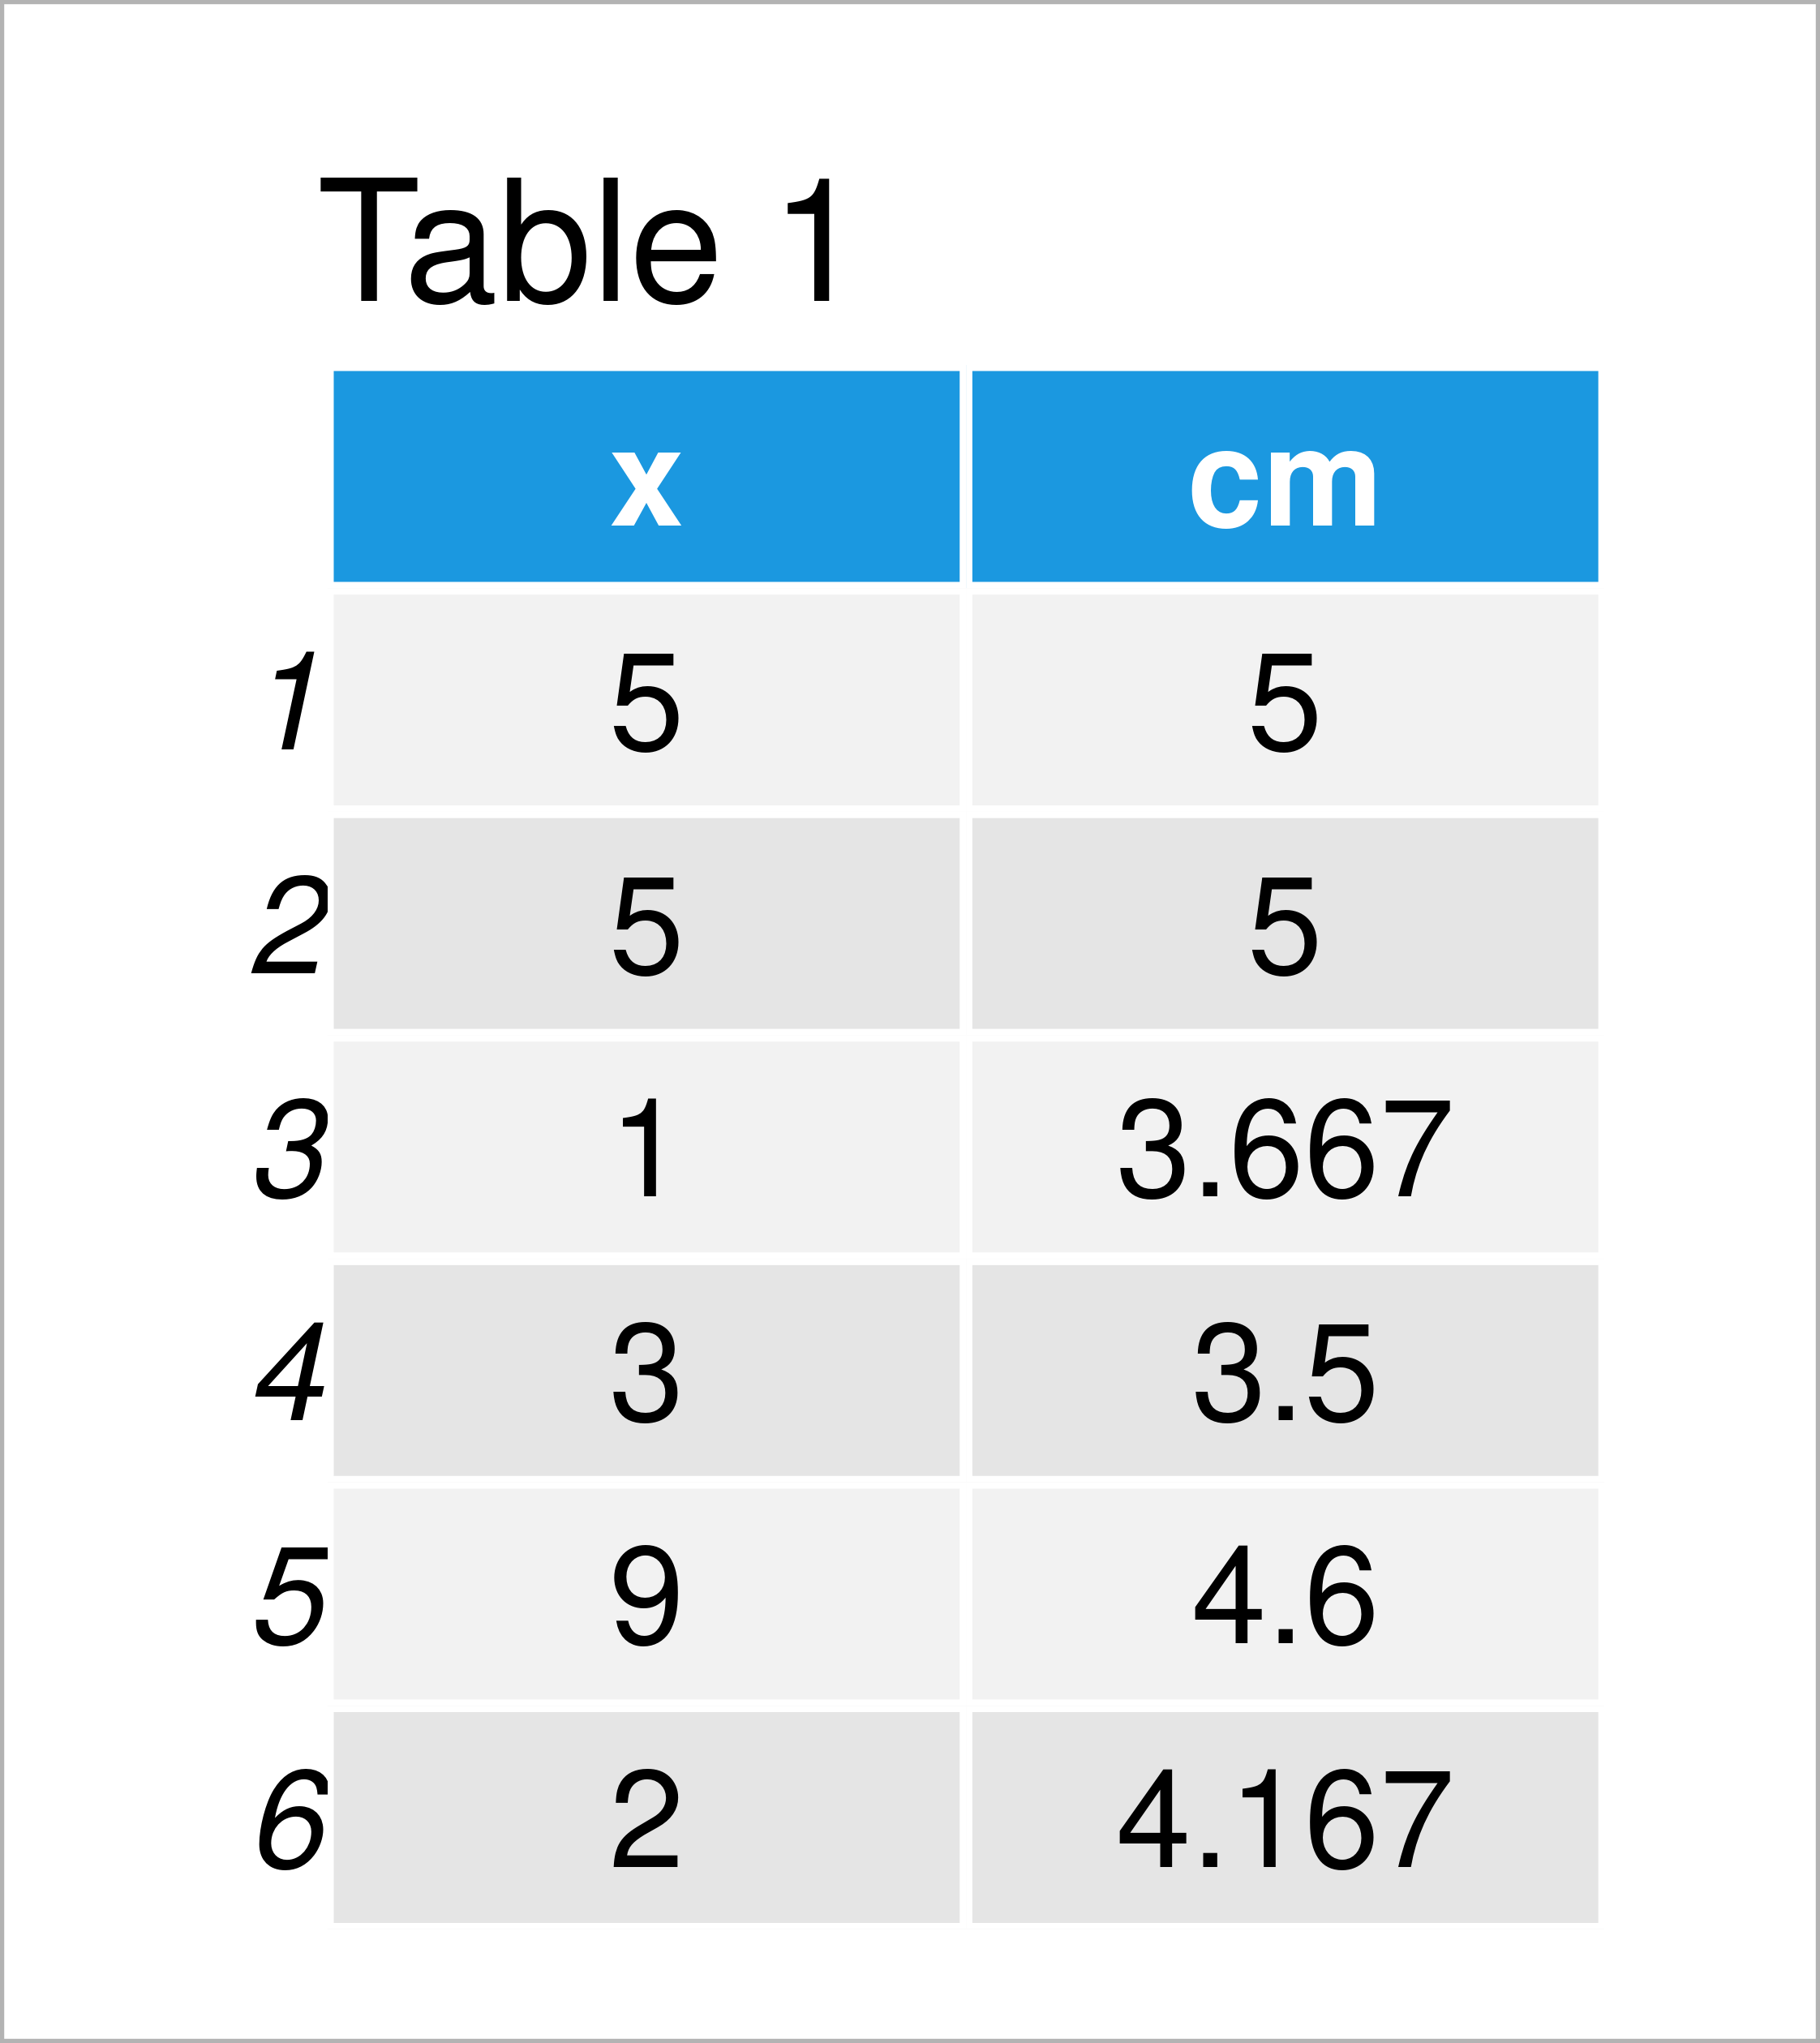
In this example, I’ll show how to create a data frame containing our original values and the cumulative mean of these values in a new variable.
For this task, we can apply the data.frame function and the cummean function of the dplyr package as shown below:
data <- data.frame(x, cm = cummean(x))    # Create data frame with cumulative mean
data                                      # Print data frame with cumulative mean

Table 1 illustrates the data frame that we have just created. Our new data frame consists of two columns. The column x contains our original input values and the column cm contains the cumulative means that correspond to our input vector.
Video, Further Resources & Summary
I have recently published a video on my YouTube channel, which shows the R syntax of this post. You can find the video below:
In addition, you might read the related articles that I have published on this website:
- cumall, cumany & cummean R Functions of dplyr Package
- cumsum Function in R
- Cumulative Frequency & Probability Table
- Calculate Moving Average, Maximum, Median & Sum of Time Series
- R Programming Tutorials
This article has demonstrated how to calculate the rolling average in the R programming language. Please let me know in the comments section, in case you have additional questions.


