plotly Chart Studio with Python (Example)
Hi! This tutorial will demonstrate how to visualize an interactive plotly graph in Chart Studio using the Python programming language.
Here is an overview:
Let’s get right into the Python code!
Create Chart Studio Account & Get Credentials
To be able to use the Chart Studio API, you need to create an account and get your username and API key. You can create a free account here and then get your username and API key.
In the next section, we will show how to use the credentials to access Chart Studio’s API.
Install & Import plotly & Chart Studio
To install and import plotly and Chart Studio, run the lines of code below in your preferred Python programming IDE or code editor:
# install plotly & Chart Studio
pip install plotly chart_studio

# import plotly & Chart Studio
import plotly.express as px

import chart_studio

import chart_studio.plotly as py
With plotly and Chart Studio installed and imported into our Python programming environment, we can now call the Chart Studio API using the credentials we created in the previous section.
To initialize Chart Studio for online plotting, run the line of code below:
chart_studio.tools.set_credentials_file(username="your username", api_key="your api key")
With your credentials set, you can now create plots locally and visualize them online inside of Chart Studio.
Create Example Dataset
We will use the tips dataset that comes pre-loaded in plotly as our example dataset in this tutorial. You can use any dataset of your choice to follow along.
To load and preview the first 10 rows of the dataset, run the lines of code below:
df = px.data.tips()

df.head(10)

#  total_bill	 tip	sex	smoker	day	time	size
#0	16.99	1.01	Female	No	Sun	Dinner	2
#1	10.34	1.66	Male	No	Sun	Dinner	3
#2	21.01	3.50	Male	No	Sun	Dinner	3
#3	23.68	3.31	Male	No	Sun	Dinner	2
#4	24.59	3.61	Female	No	Sun	Dinner	4
#5	25.29	4.71	Male	No	Sun	Dinner	4
#6	8.77	2.00	Male	No	Sun	Dinner	2
#7	26.88	3.12	Male	No	Sun	Dinner	4
#8	15.04	1.96	Male	No	Sun	Dinner	2
#9	14.78	3.23	Male	No	Sun	Dinner	2
Now that we have loaded the example dataset, we can now build an interactive graph and visualize it in Chart Studio online.
Create & Visualize Graph in Chart Studio
We will build a simple box plot and visualize it in Chart Studio. Run the lines of code below:
fig = px.box(df,
             x = "sex",
             y = "tip",
             color = "time",
             color_discrete_map = {"Dinner": "blue", "Lunch": "yellow"},
             template = "presentation")

py.plot(fig, filename = "box-plot", auto_open = True)
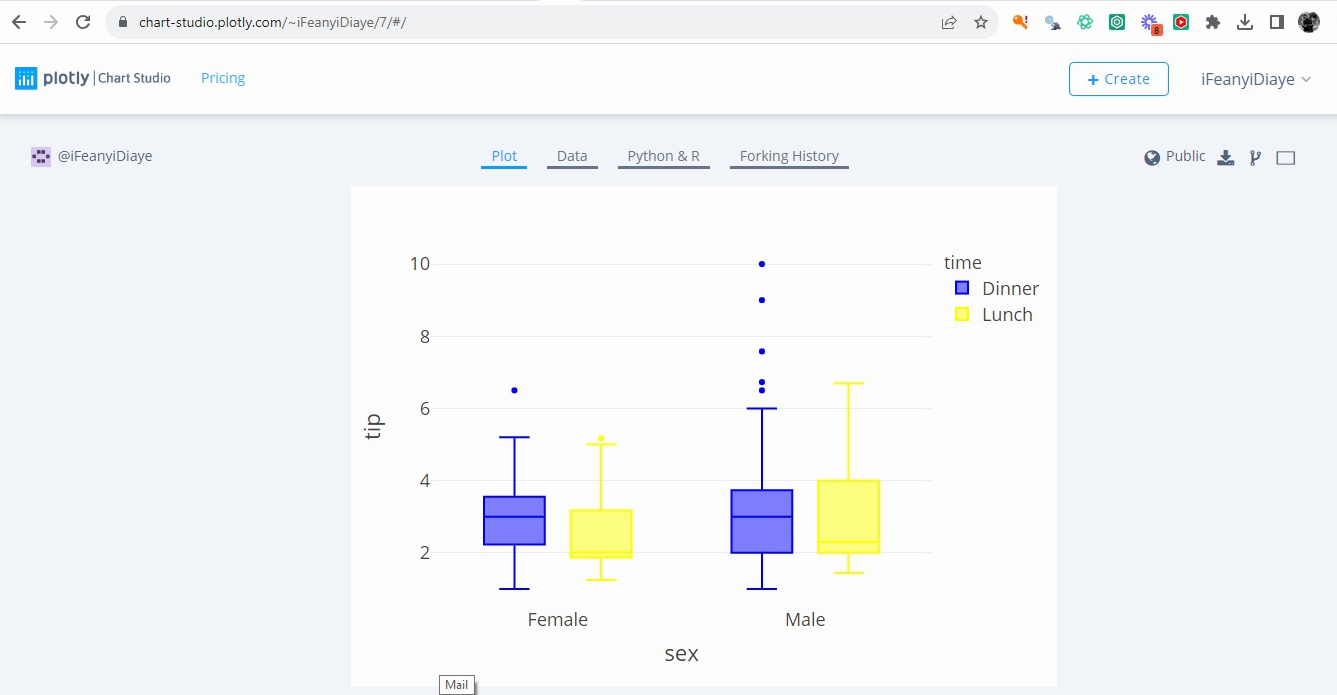
When you run the above code, it would automatically open the plot in your web browser like this

However, depending on your Python environment, you may rather see a URL comprising your Chart Studio username printed to your console. You can copy and paste that URL into your browser to visualize the plot.
Now, you can interact with the plot you just created with plotly. The px.box() method in the above example is employed to generate the box plot using data from the DataFrame df.
The plot is organized by the sex column on the x-axis, with tip values on the y-axis. The boxes are colored based on the time column and a custom color mapping is applied, where Dinner is represented in blue and Lunch in yellow. The chosen template for the plot is "presentation", which may affect the visual styling.
Finally, the py.plot() method is used to save and display the plot as an HTML file named "box-plot" and the auto_open parameter is set to True, allowing the plot to automatically open in a web browser after it’s generated.
Now the plot and the data are saved in your Chart Studio account! You can share the link to your plot with others or embed it as an iframe in your website.
Video, Further Resources & Summary
Do you need more explanations on how to visualize a plotly graph in Chart Studio using Python? Then, you should have a look at the following YouTube video of the Statistics Globe YouTube channel.
In the video, we explain in some more detail how to visualize a plotly graph in Chart Studio using Python.
The YouTube video will be added soon.
With that, we have learned how to visualize an interactive plotly graph in Chart Studio using Python. Furthermore, you could have a look at some of the other interesting plotly in Python tutorials on Statistics Globe:
- Animate Interactive plotly Graph in Python (2 Examples)
- plotly Candlestick Chart in Python (3 Examples)
- plotly Bubble Chart in Python (3 Examples)
- plotly Treemap in Python (3 Examples)
- plotly Table in Python (4 Examples)
- Introduction to Python Programming
This post has shown how to visualize a plotly graph in Chart Studio using Python. I hope you found it helpful! In case you have further questions, you may leave a comment below.
This page was created in collaboration with Ifeanyi Idiaye. You might check out Ifeanyi’s personal author page to read more about his academic background and the other articles he has written for the Statistics Globe website.


