Using hjust & vjust to Move Elements in ggplot2 Plots in R (3 Examples)
In this R tutorial you’ll learn how to apply the hjust and vjust arguments.
Table of contents:
So without further ado, let’s dive right in.
Example Data, Add-On Packages & Basic Graphic
The following data will be used as basement for this R tutorial:
data <- data.frame(x = 1:5,         # Create example data
                   y = 7:3)
data                                # Print example data
#   x y
# 1 1 7
# 2 2 6
# 3 3 5
# 4 4 4
# 5 5 3
The previous output of the RStudio console shows the structure of our example data: It’s a data frame with five rows and two numeric columns.
If we want to use the functions of the ggplot2 package, we also have to install and load ggplot2:
install.packages("ggplot2")         # Install ggplot2 package
library("ggplot2")                  # Load ggplot2 package
As next step, we can draw our data:
ggp <- ggplot(data, aes(x, y)) +    # ggplot2 plot with default hjust & vjust
  geom_point() +
  ggtitle("My Title") +
  theme(plot.title = element_text(colour = "red"))
ggp                                 # Draw ggplot2 plot

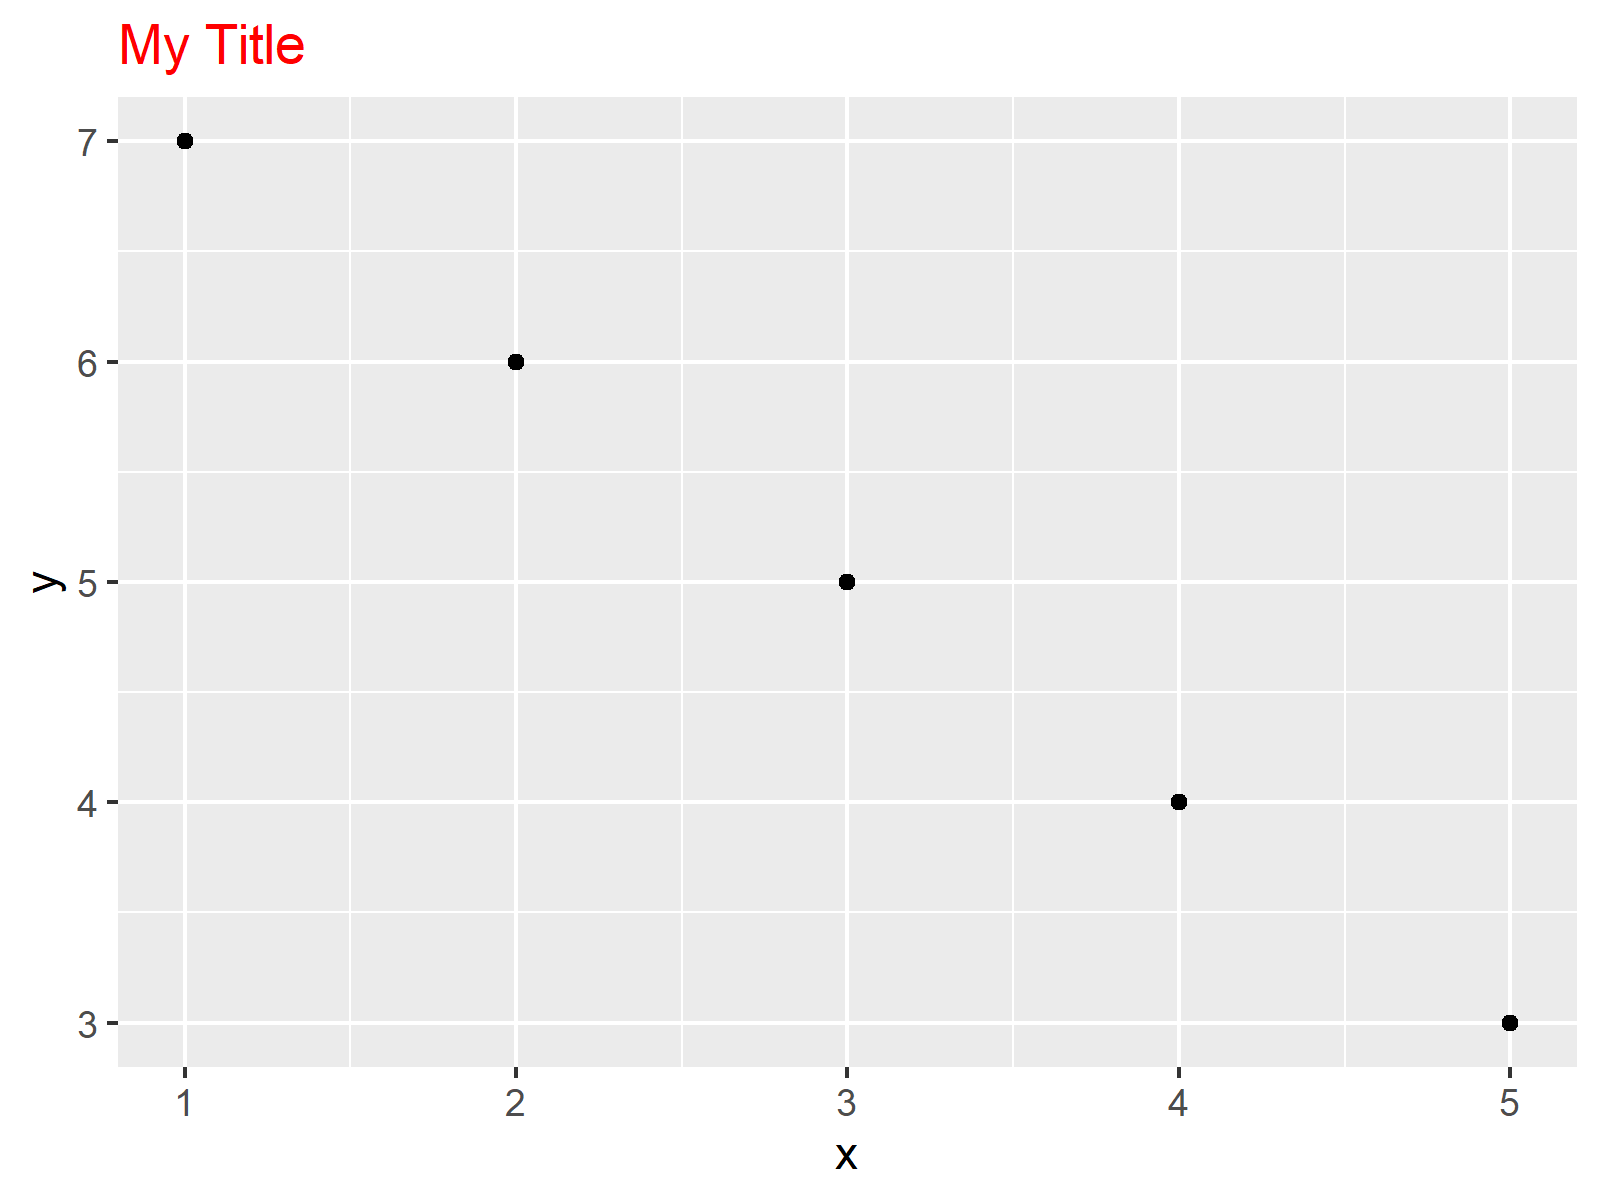
Figure 1 shows the output of the previous R programming code: A ggplot2 scatterplot with main title. The positions of all plot elements correspond to the default specifications of the ggplot2 package.
In the following examples, we’ll change the location of our plot title using the hjust and vjust arguments.
Note that hjust and vjust could also be applied to other plot elements such as axis text, axis values or annotated text elements within the plot.
Anyway, let’s dive into the examples!
Example 1: Center ggplot2 Title Using hjust = 0.5
The hjust argument is used to move the location of ggplot2 plot elements horizontally (hjust stands for horizontal adjustment).
This example shows how to apply the hjust argument within the theme & element_text functions to move our main title to the middle of the plot.
Have a look at the R code below:
ggp +                               # Centering title
  theme(plot.title = element_text(hjust = 0.5))

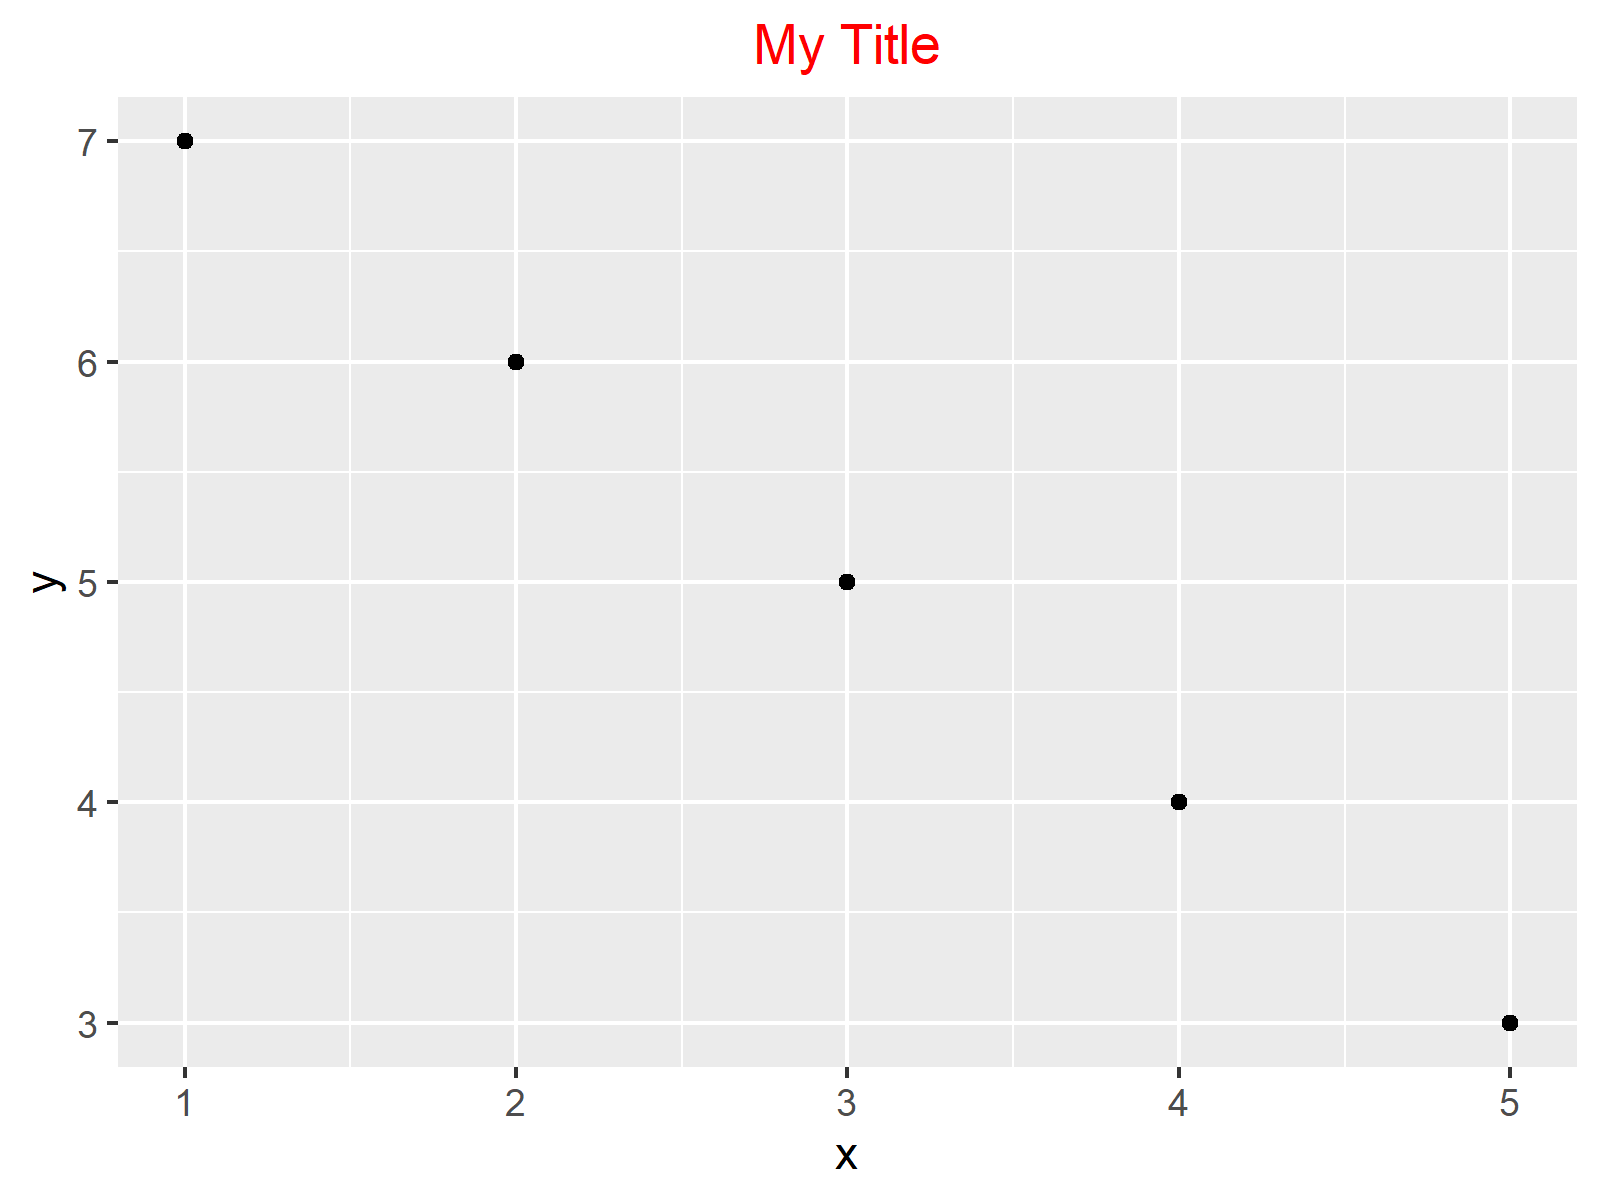
As shown in Figure 2, the previously shown R code created a scatterplot with centered main title.
Example 2: Right-align ggplot2 Title Using hjust = 1
The R code below shows how to right-align our main title using the hjust argument. For this, we have to specify hjust to be equal to 1:
ggp +                               # Right-align title
  theme(plot.title = element_text(hjust = 1))

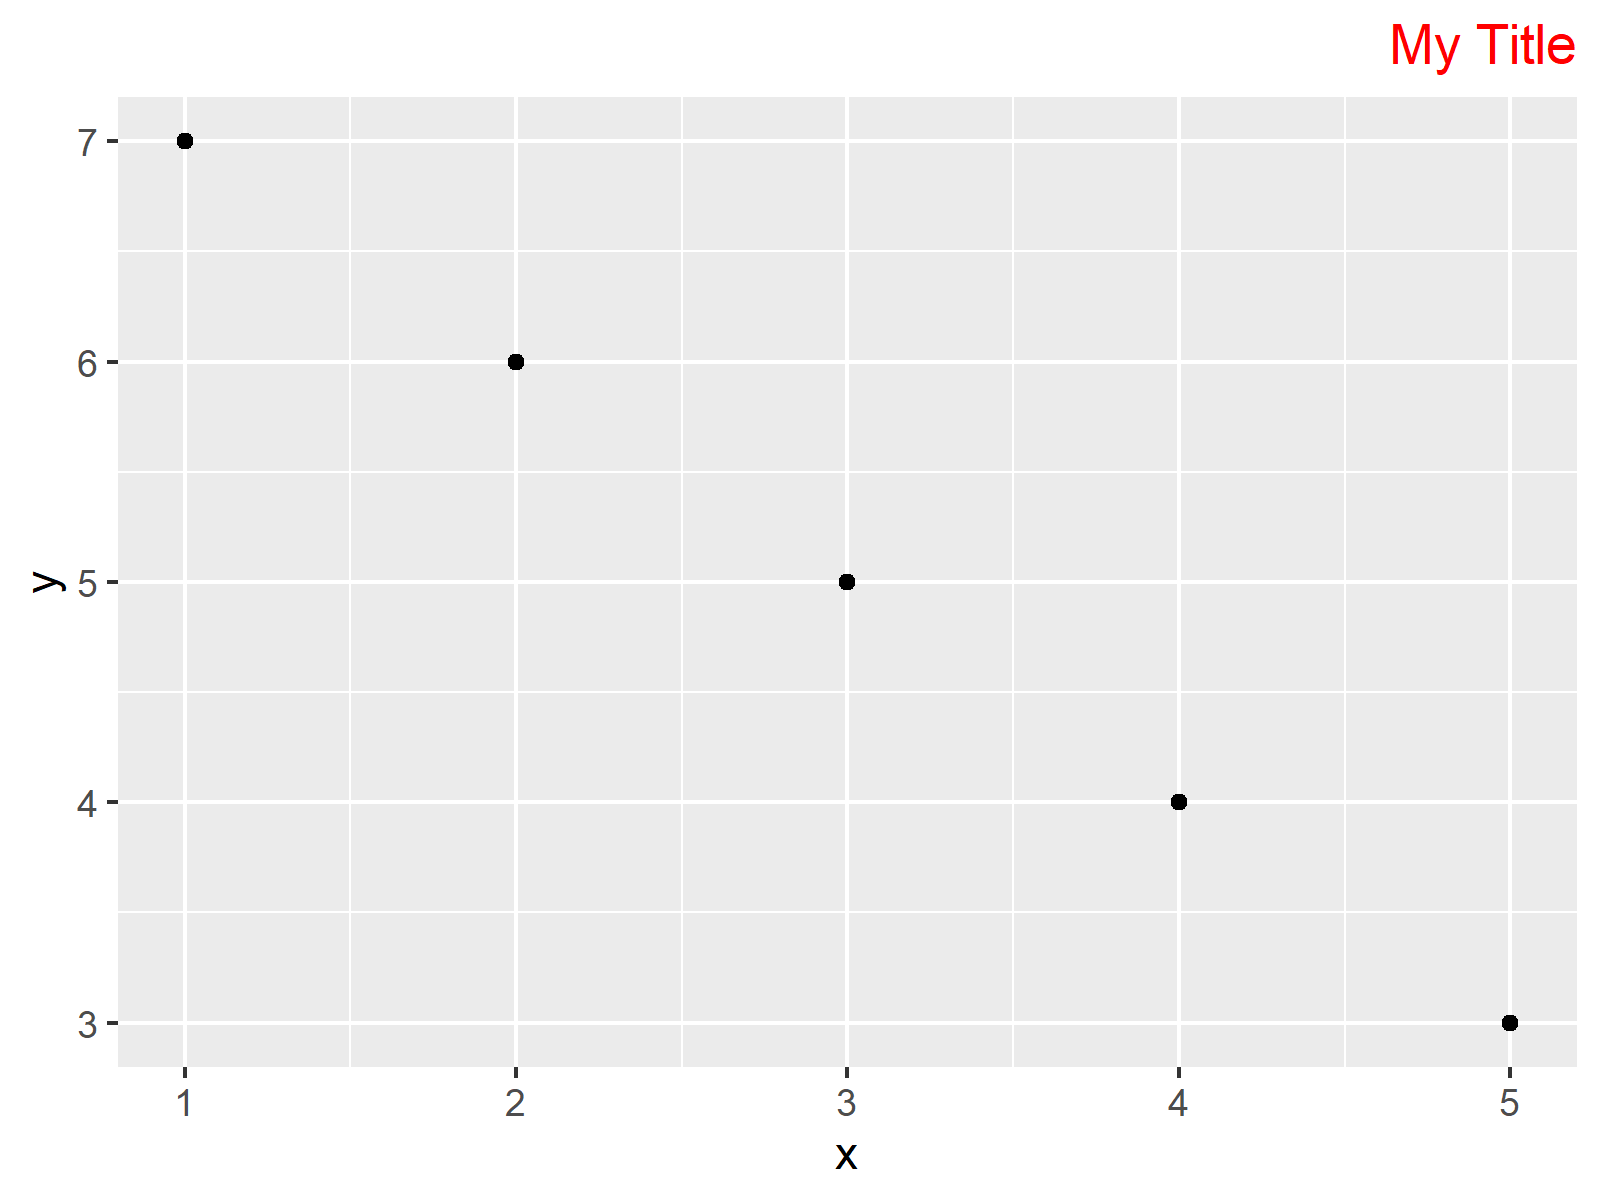
Figure 3 reveals the output of the previous R programming syntax – A ggplot2 graph with right-aligned main title.
Example 3: Move Position of ggplot2 Title Inside of Plot Using vjust
The vjust argument is used to move the location of ggplot2 plot elements vertically (vjust stands for vertical adjustment).
Example 3 explains how to apply the vjust argument to move our title inside of the plot area. For this, we are specifying the vjust argument to be equal to – 20:
ggp +                               # Move title inside of plot
  theme(plot.title = element_text(vjust = - 20))

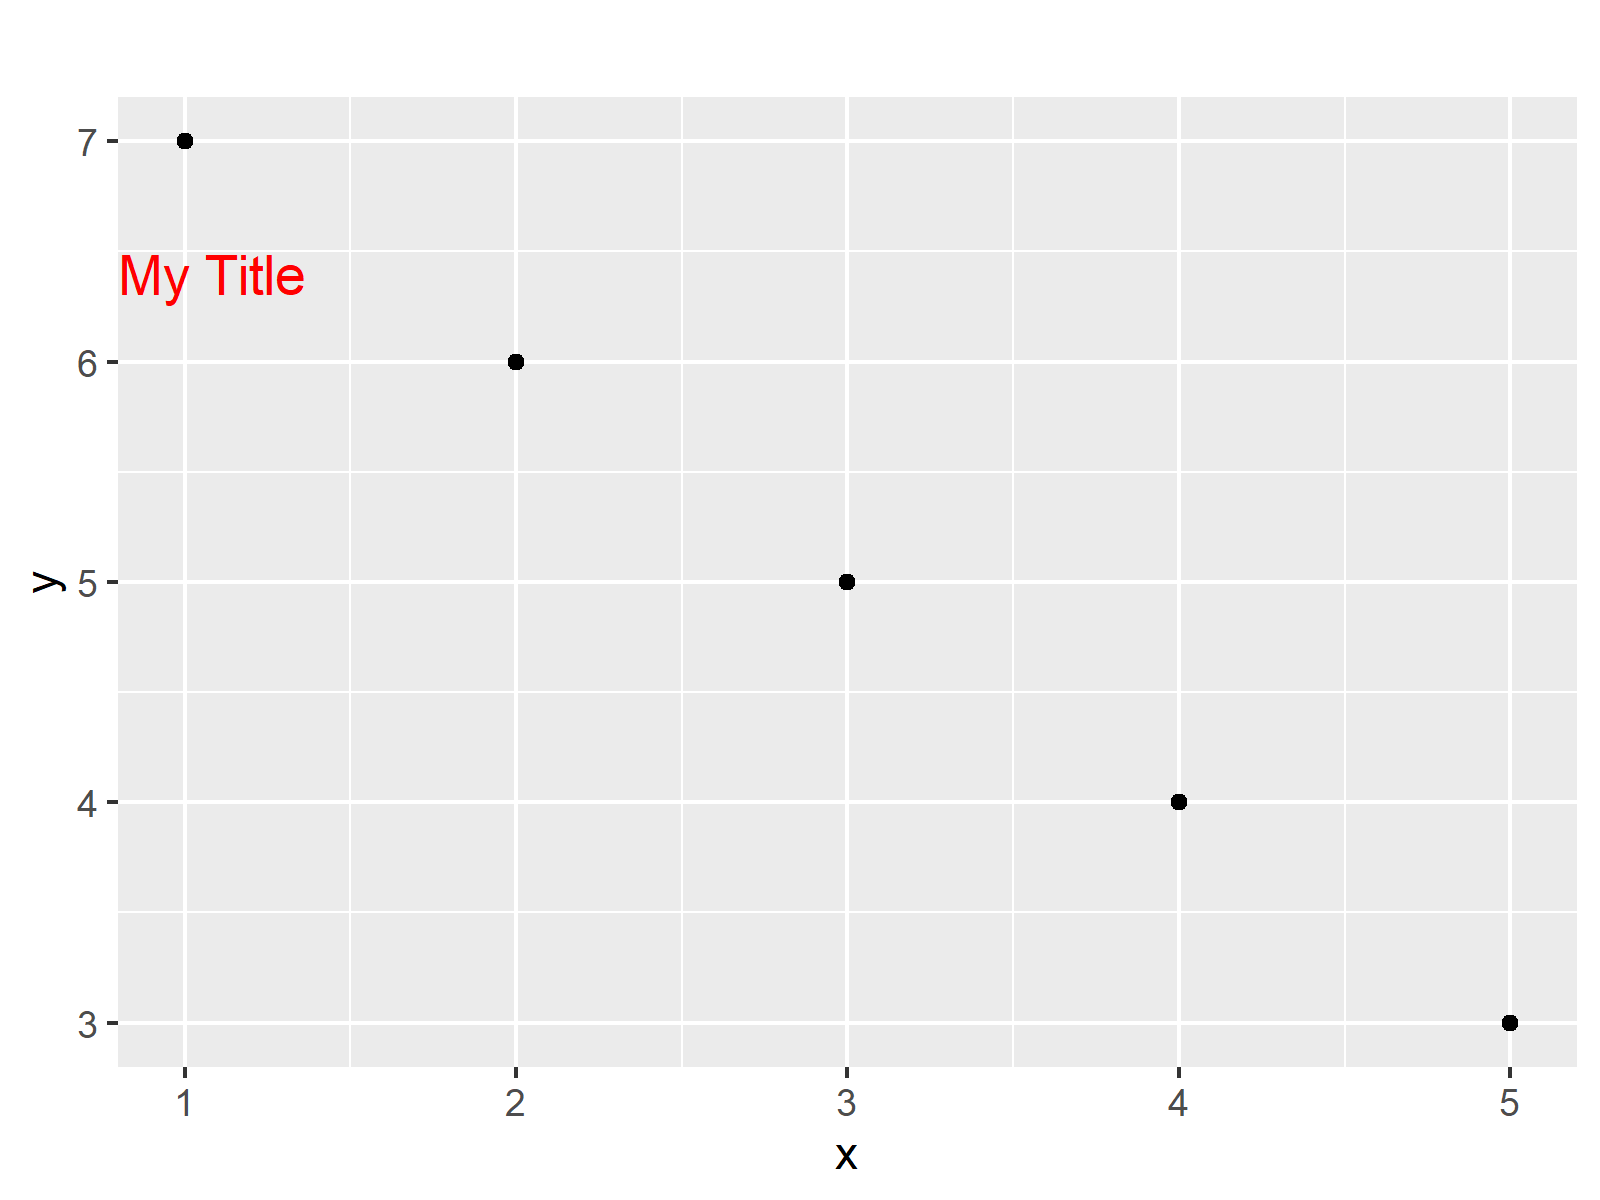
As shown in Figure 4, the previous syntax created a ggplot2 graphic with main title inside of the plotting area.
Video & Further Resources
I have recently published a video on my YouTube channel, which shows the R programming codes of this tutorial. You can find the video below.
Besides that, you could have a look at the related tutorials of https://statisticsglobe.com/. I have published several related tutorials already:
In this article you learned how to use hjust and vjust in ggplot2 plots in R programming. Don’t hesitate to tell me about it in the comments, in case you have further questions and/or comments. Besides that, don’t forget to subscribe to my email newsletter in order to receive updates on new articles.


