R Error: plot.new has not been called yet (2 Examples)
In this R programming article you’ll learn how to solve the error “plot.new has not been called yet”.
The page looks as follows:
It’s time to dive into the exemplifying R code:
Example 1: Reproduce the Error: plot.new has not been called yet
Example 1 illustrates how to replicate the error message “plot.new has not been called yet” in R.
Let’s assume that we want to draw a line to a plot. Then, we might try to use the lines function as shown below:
lines(1:10)                # Try to add lines to non-existent plot
# Error in plot.xy(xy.coords(x, y), type = type, ...) :
#   plot.new has not been called yet
Unfortunately, the RStudio console returns the error message “plot.new has not been called yet”.
The reason for this is that some functions require that a plot was already created before their application (the lines function is one of them).
Next, I’ll show you how to solve this problem.
Example 2: Fix the Error: plot.new has not been called yet
Example 2 illustrates how to fix the error message “plot.new has not been called yet”.
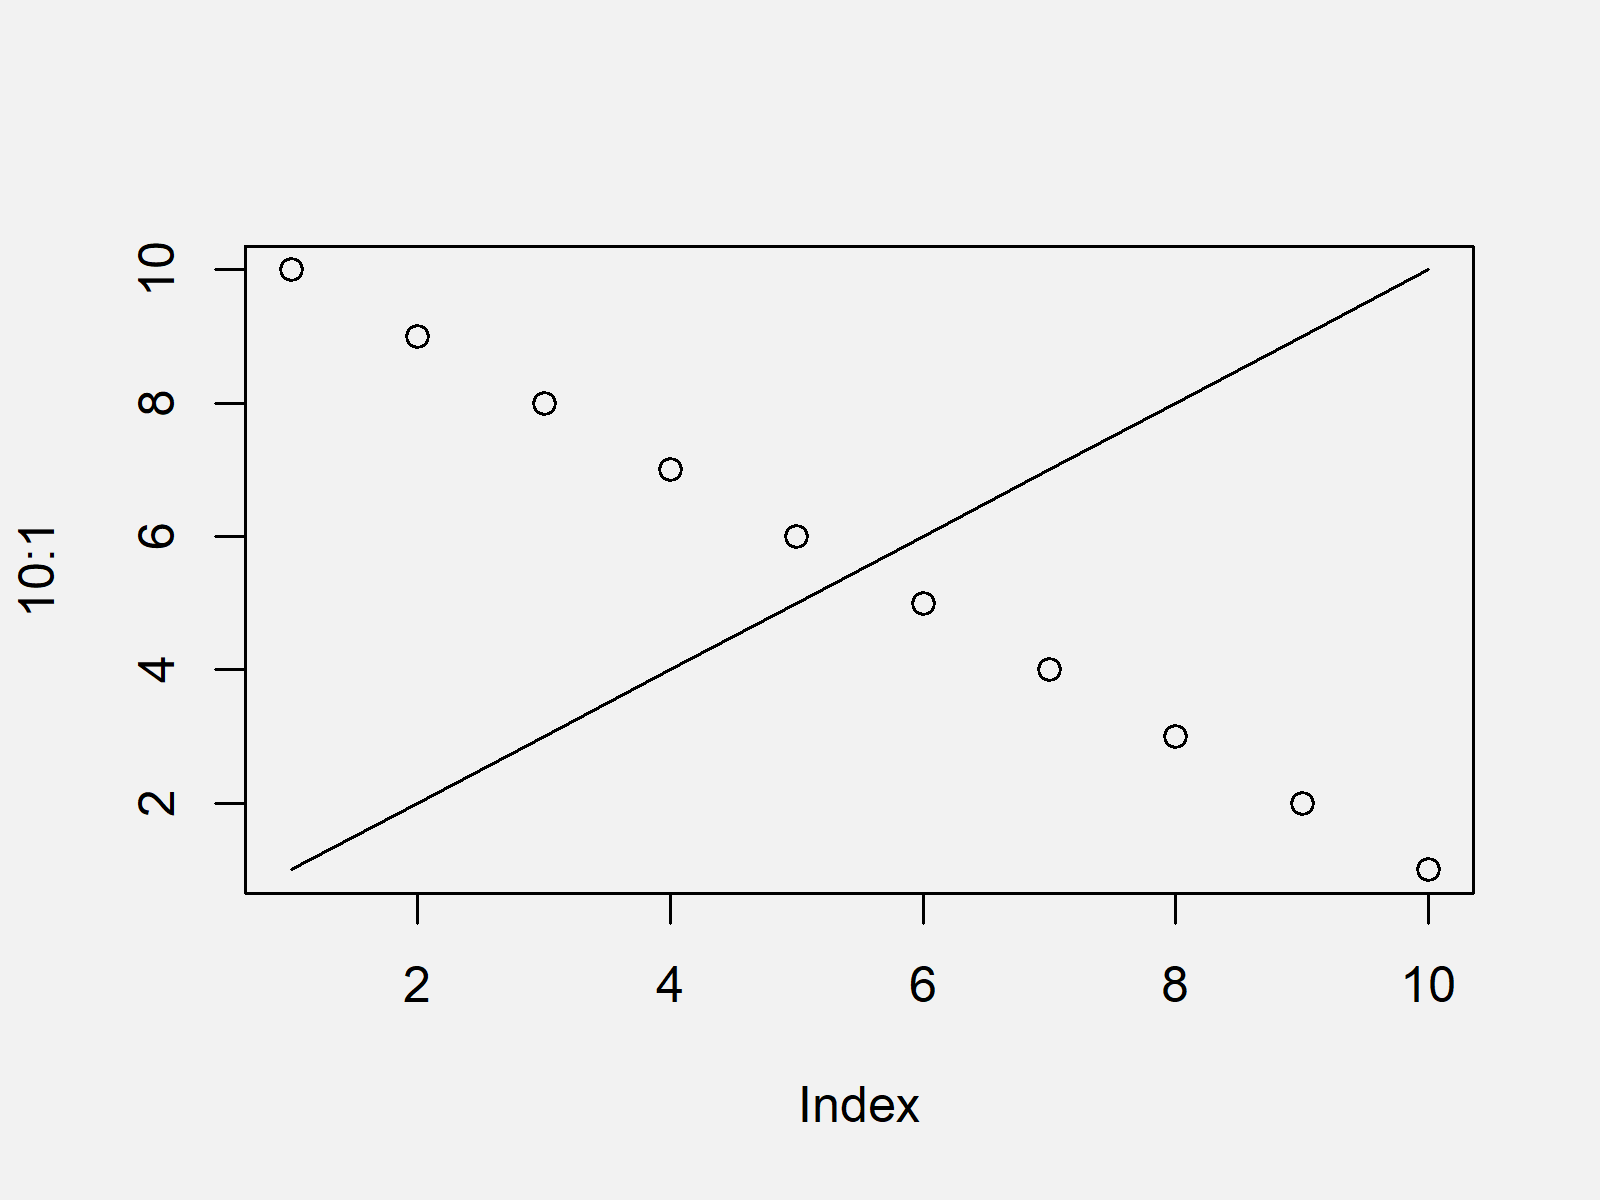
As explained in Example 1, we first have to draw a graphic before we can apply the lines function. Have a look at the following R code:
plot(10:1)                 # Draw plot
lines(1:10)                # Add lines to plot

As shown in Figure 1, we created a scatterplot containing a line with the previous R programming syntax.
Video, Further Resources & Summary
Have a look at the following video of my YouTube channel. I illustrate the R code of this tutorial in the video.
Besides the video, you could have a look at the related articles of this website:
This tutorial explained how to handle the error message “plot.new has not been called yet” in the R programming language.
In this tutorial, we have used the lines function to illustrate the error message. Please note that other functions such as abline lead to the same (or very similar) error messages, when a plot has not been created before these functions are called.
If you have any additional questions, please let me know in the comments section below.


2 Comments. Leave new
Hello!
Very helpful site but I find the ads overwhelm the important content. If you could keep content and ads in separate columns would be an improvement.
Cheers
Hi Vince,
Thank you for the kind words and your feedback. Please note that all content on Statistics Globe is for free, and ads are the only way how I can earn some money for my work. However, in case you find the ads too distracting, you may use an ad blocker.
Regards,
Joachim