Add Header to Data Frame in R (Example)
In this article, I’ll explain how to read a data set without header and adjust the column names in R programming.
The post is structured as follows:
Let’s start right away.
Introducing Example Data
First, we’ll have to create some example data:
data <- data.frame(x1 = 3:6,                        # Create data frame
                   x2 = 1:4,
                   x3 = letters[5:8],
                   x4 = "x")
data                                                # Print data frame
#   x1 x2 x3 x4
# 1  3  1  e  x
# 2  4  2  f  x
# 3  5  3  g  x
# 4  6  4  h  x
As you can see based on the previously shown output of the RStudio console, our example data has four rows and four columns. At this point, our data set also has a header (i.e. column names).
Now, let’s export this data frame as CSV file without header to the working directory on our computer:
write.table(data,                                   # Export CSV file without column names
            "data.csv",
            sep = ";",
            row.names = FALSE,
            col.names = FALSE)
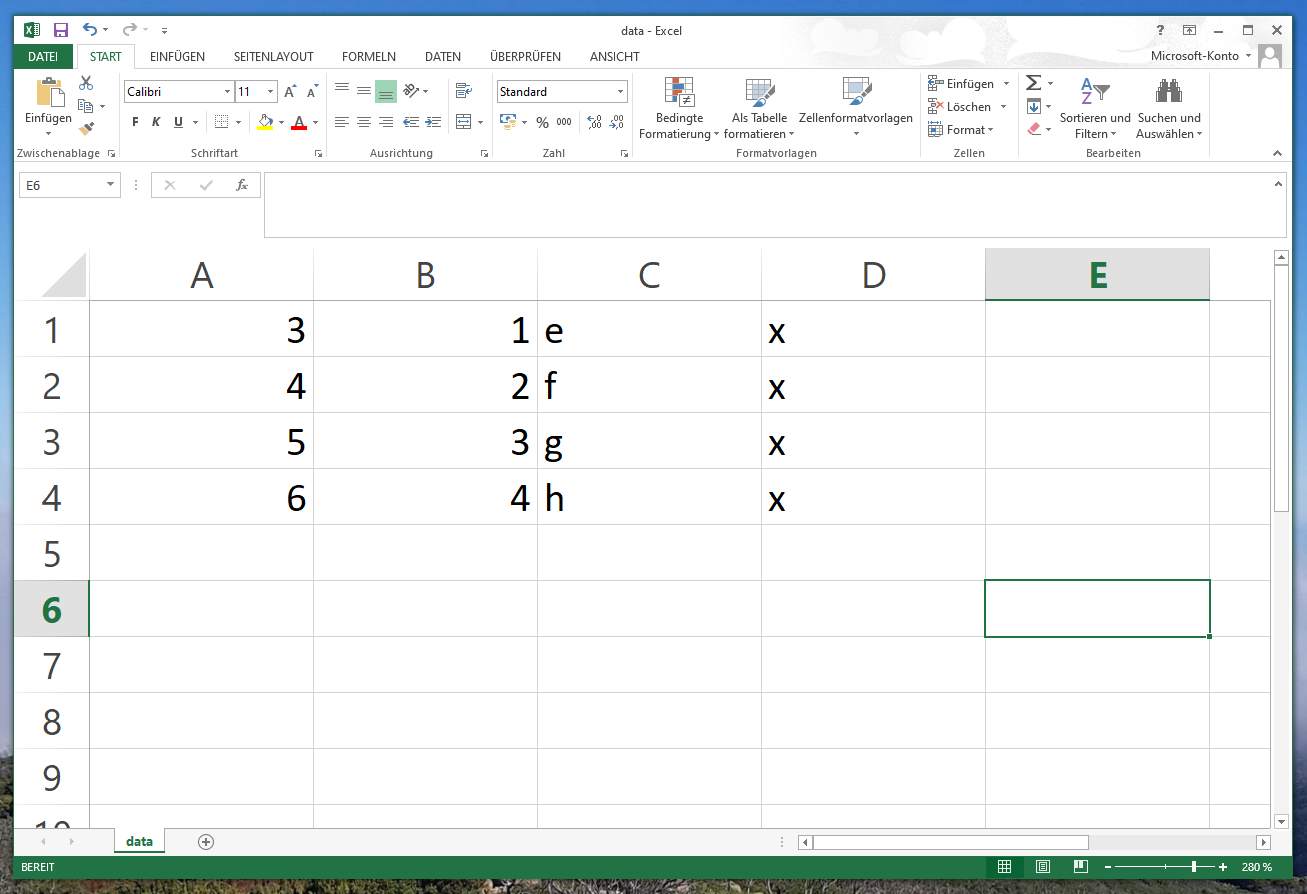
After running the previous R syntax, you should find a CSV file on your computer that looks as follows:

Now, let’s import this file back to R using the read.csv2 function:
data_nohead <- read.csv2("data.csv",                # Import CSV file without column names
                         header = FALSE)
data_nohead                                         # Print data frame with automatic names
#   V1 V2 V3 V4
# 1  3  1  e  x
# 2  4  2  f  x
# 3  5  3  g  x
# 4  6  4  h  x
As you can see based on the previous output of the RStudio console, our reloaded example data has an automatically assigned header. The variables are called V1, V2, V3, and V4.
That’s probably not what we wanted… So let’s change it!
Example: Adding Header to Data Frame Using colnames() Function
In this example, I’ll show how to rename the variable names of a data set without header.
For this, we can use the colnames function as shown below:
colnames(data_nohead) <- c("x1", "x2", "x3", "x4")  # Adjust column names
data_nohead                                         # Print updated data frame with header
#   x1 x2 x3 x4
# 1  3  1  e  x
# 2  4  2  f  x
# 3  5  3  g  x
# 4  6  4  h  x
Have a look at the previous output of the RStudio console: It shows that our data frame looks exactly the same as in the very beginning. In other words, we have added a header to our imported data frame.
Video, Further Resources & Summary
Do you want to know more about data frames and data manipulation in R? Then you may watch the following video of my YouTube channel. In the video tutorial, I illustrate the topics of this tutorial in RStudio:
The YouTube video will be added soon.
Furthermore, you may have a look at the other articles of this website:
- Append to Data Frame in Loop
- Add Index ID to Data Frame in R
- Add New Row at Specific Index Position to Data Frame
- Add New Column to Data Frame in R
- R Programming Language
In summary: In this article, I illustrated how to add a header to a data matrix in the R programming language. Please let me know in the comments below, in case you have additional comments and/or questions.


