Join Our Interactive Live Webinar: Data Analysis & Visualization in R
Learn to unlock the full potential of your data using R
without wasting time with too much unnecessary talk.
Price: $25
Note: The live session of this webinar has already been conducted. By enrolling, you will gain access to a recording of the live session and all additional learning materials.

This webinar teaches you the essentials of data projects in R, step-by-step.
- Even if… you’re new to data analysis and visualization.
- Even if… you’ve struggled with R programming in the past.
- Even if… you’ve understood the statistical basics, but don’t know where to start with your data.
- Even if… you’ve thought to yourself “working with real data is too complicated for me”.
What You Get
By enrolling in this webinar, you’ll gain access to a 1-hour live session hosted by Joachim Schork and the Statistics Globe team, focusing on analyzing and visualizing data sets using R.
During the session, we’ll work through an R script, supported by theoretical explanations to enhance your understanding and application skills. You’ll have the opportunity to ask questions in real-time through our live chat feature, ensuring interactive and responsive learning.
After the live session, your education continues with targeted exercises and additional resources designed to deepen your knowledge and refine your skills.
If you miss the live event or need to revisit the materials, no worries! You’ll receive lifetime access to the session recording, R scripts, and exercises, allowing you to learn at your own pace.
Here are some more details on the webinar structure!

A Peek Inside the Webinar
Join us for an interactive live webinar where we’ll explore the fascinating world of data analysis and visualization in R programming, guiding you through each step of a complete data project.
From downloading and importing data to mastering data manipulation techniques, we’ll cover the essentials together. You’ll learn how to calculate and print descriptive statistics for valuable insights and delve into estimating regression models to understand complex data relationships. Then, we’ll dive into the captivating domain of data visualization, empowering you to create visually compelling representations of your findings.
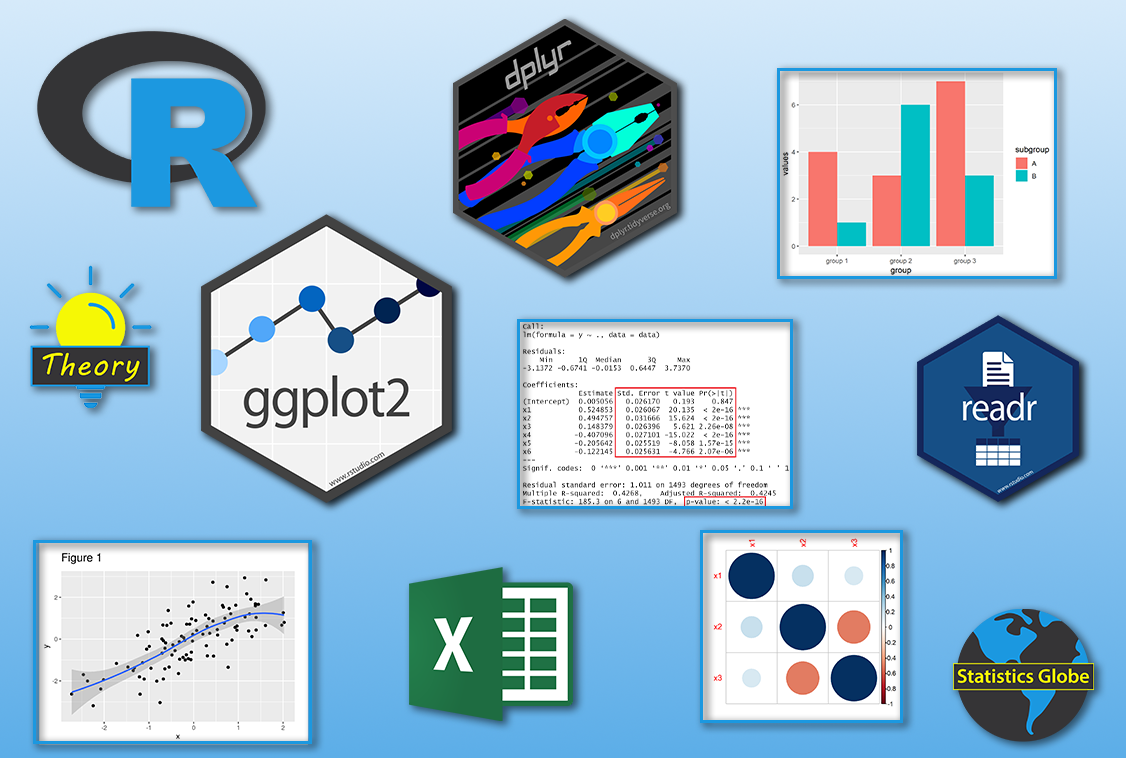
Throughout the session, we’ll utilize various tidyverse packages such as readr, dplyr, and ggplot2, offering you a chance to enhance your tidyverse skills while exploring the mysteries of data analysis and visualization.
Despite our limited time, we’ll ensure to cover the key aspects of data projects, offering you a thorough understanding of their essential components. Don’t miss this opportunity to unleash the full potential of your data!
Here’s the table of contents of the entire webinar.
Table of Contents
- Introduction to Relevant Packages
- Data Download & Import Using readr
- Data Manipulation Using dplyr
- Calculation of Descriptive Statistics
- Estimation of Regression Models
- Data Visualization Using ggplot2
Love It or Return It: 30 Days Money-Back Guarantee
Your purchase is absolutely risk-free with our straightforward money-back guarantee! We are confident that our webinar will not disappoint you.
However, if you don’t like what you see, you can get a 100% refund up to 30 days after the webinar.
Meet Your Instructor: Joachim Schork
Hey, I’m Joachim Schork and back in the days, when I started my journey as a programmer and statistician, applying statistical methodology in R programming felt like an impossible challenge to me.
After finishing my bachelor’s degree in Educational Science, I decided to focus more on programming and statistics, but when I started my master’s in survey statistics, I felt hopeless. Do you know that moment when you scream at your PC screen after several hours of unsuccessful coding attempts?
Since the start of my educational journey, I have used online resources to complement the university’s official learning materials. This has helped me a lot, but at the same time I felt like I was often spending too much time on a video or blog article because many of these resources don’t get straight to the point.
This was one of the reasons why I founded Statistics Globe more than five years ago. Meanwhile, I had completed my master’s degree, got my first job at a national statistical institute in Europe, and was rewarded with an EMOS certificate that approves special knowledge in the field of official statistics. I had gained extensive knowledge in the area that I wanted to pass on.
However, I didn’t want to create endless tutorials that didn’t fulfill the need of its users. Instead, I created straightforward content designed to guide users to solutions for their problems as quickly as possible.
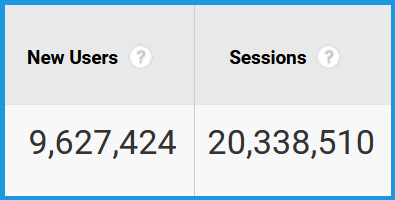
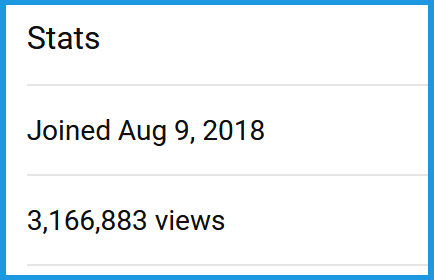
Now, five years later, Statistics Globe has gained:
20 million clicks
on the website
3 million clicks
on YouTube videos
60 thousand followers
across Social Media platforms
- 27,589 YouTube Subscribers
- 23,241 Facebook Group Members
- 6,863 LinkedIn Followers
- 6,828 X (Formerly Twitter) Followers
This is such an incredible success, and I’m so thankful to everybody who participated in this journey! And please don’t get me wrong: I don’t want to brag about these numbers, but I think they can show you that my content works.
With this online webinar, I’ve combined all of this experience and knowledge into a single resource on how to use the R programming language to effectively analyze and visualize data sets.
However, the objective extends beyond handling the specific data sets presented in this webinar; it also aims to improve your overall data science skills, enabling you to implement the demonstrated techniques on your own data.
This is the very first webinar hosted by Statistics Globe — a significant milestone for me, and I am very excited about it. I love exchanging with other data enthusiasts, and I am looking forward to our discussions via our live chat feature. I promise that I will invest all my passion into this webinar to make it an outstanding experience to all of us.
I’m not the only one who will support you in this webinar, though! The entire Statistics Globe team is ready to answer your questions, no matter if you have problems understanding any of the lessons or exercises, or if you have technical issues with the R software, the example data, or the add-on packages that we’ll use in the webinar.
At this point, I want to express my profound appreciation to all the team members at Statistics Globe for their tremendous support in developing this webinar. Special thanks to Micha Gengenbach for his exceptional contributions to the video editing and marketing. His efforts were crucial to the success of this webinar.
In case you have further questions or anything else you would like to talk about, feel free to email me to joachim@statisticsglobe.com, write me via the contact form, or send me a message via my Social Media channels.
Clicking this button will direct you to the checkout page, where you can enroll in the webinar. I’d be honored to have you in the webinar and start learning together. 🙂


6 Comments. Leave new
Iam interested
Hey Marwan,
Thank you for the kind comment, that’s great to hear. See you on Tuesday! 🙂
Regards,
Joachim
I am interested. Could you share the fees structure in INR and indian standard timings.
Hey,
Glad you are interested! According to Google, $25 is approximately 2,087.16 INR, and the course starts at 7:00 PM Indian Standard Time.
See you tomorrow,
Joachim
Hi Joachim, for some reason I couldn’t don’t see or access the live event. On the Gumroad app I can’t see it either. How can I access it?
Hey Luis,
You should have received an email from info@statisticsglobe.com with all the details on how to access the materials already a few days ago. Maybe it was moved to your spam folder? The recording of the live session is already online. Please let me know if you still have problems to access the materials.
Regards,
Joachim