Reset par to Default Values in R (Example)
In this article, I’ll show how to set the par options back to default in the R programming language.
Table of contents:
Let’s dive right into the exemplifying R syntax.
Example Plot with User-Defined par Options
Let’s first define some par options for a plot.
par(mar = c(10, 10, 10, 10)) # Set par options
Now, we can draw a plot with these par options as shown below:
plot(1:10) # Create plot

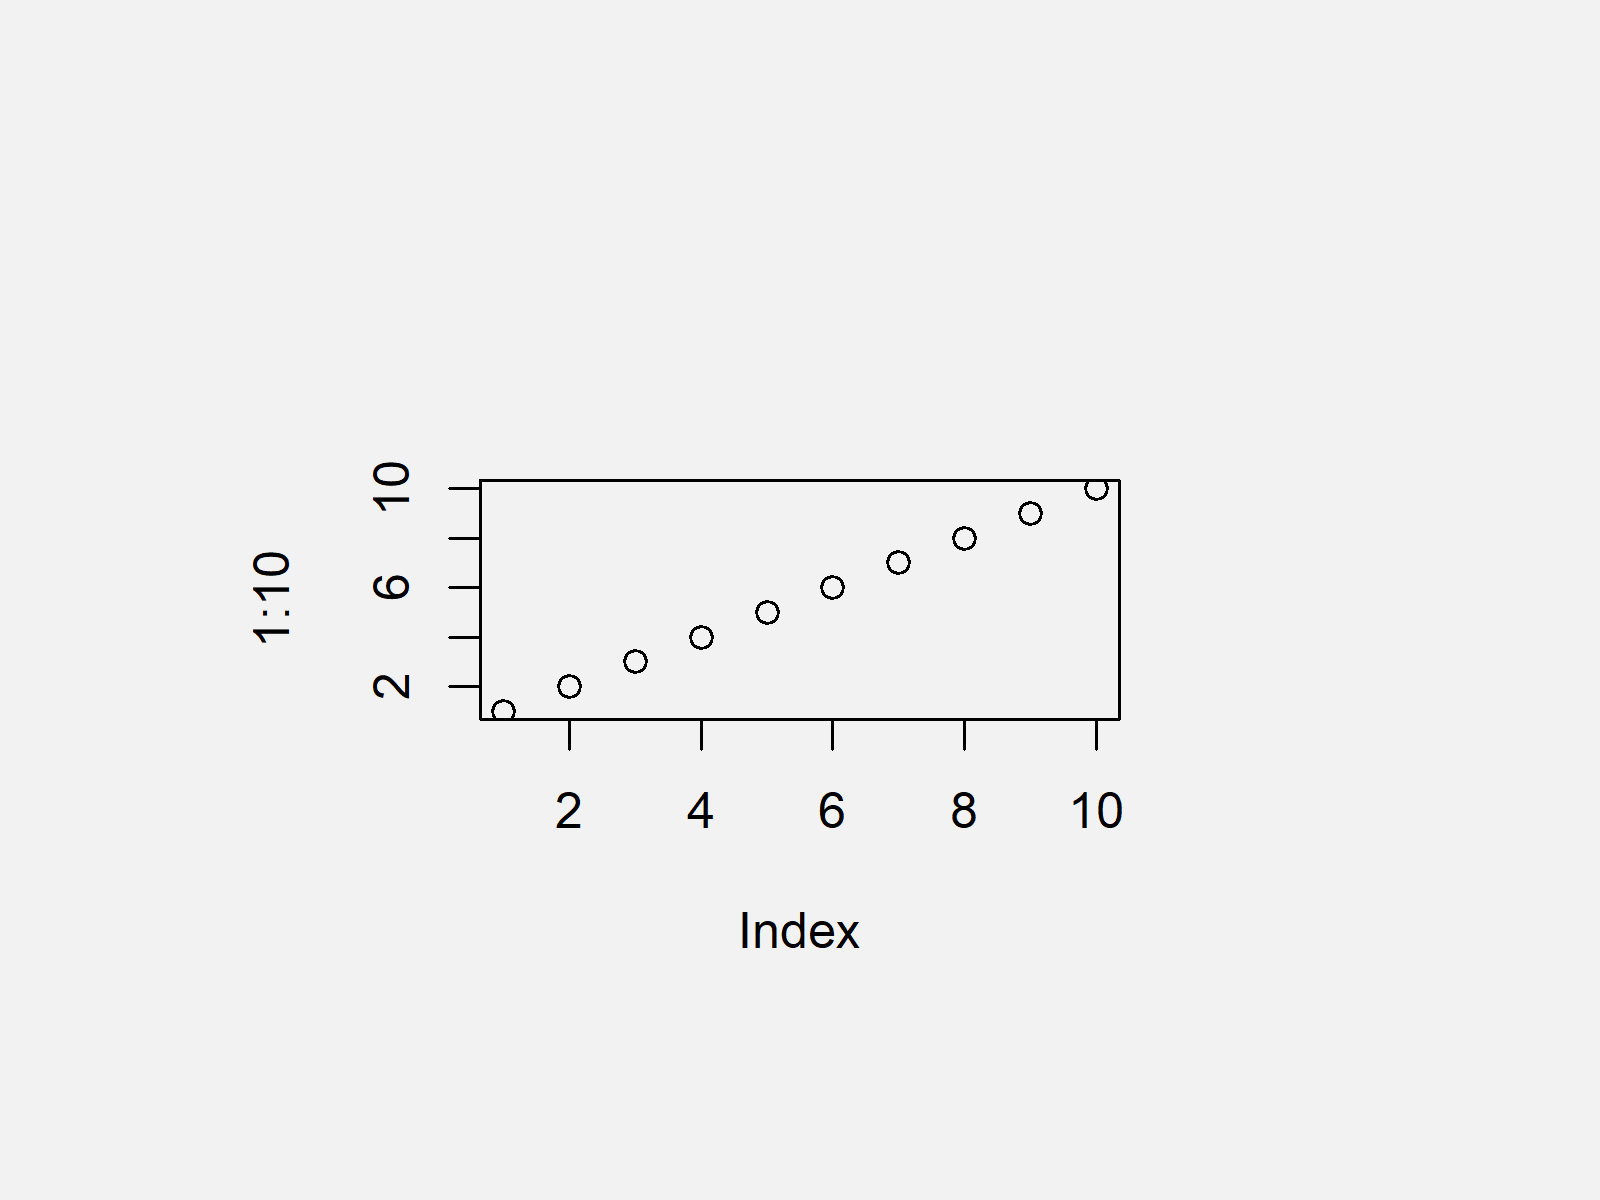
Figure 1 shows the output of the previous R syntax: A simple scatterplot in R. You can also see that the borders of the plot show a lot of white space (as specified in par).
Example: Resetting par Options Using dev.off() Function
The following R programming code illustrates how to reset the par specifications back to the default settings. In the following R code, we are using the dev.off function to reset par:
dev.off() # Applying dev.off
Let’s draw our plot again:
plot(1:10) # Creating plot again

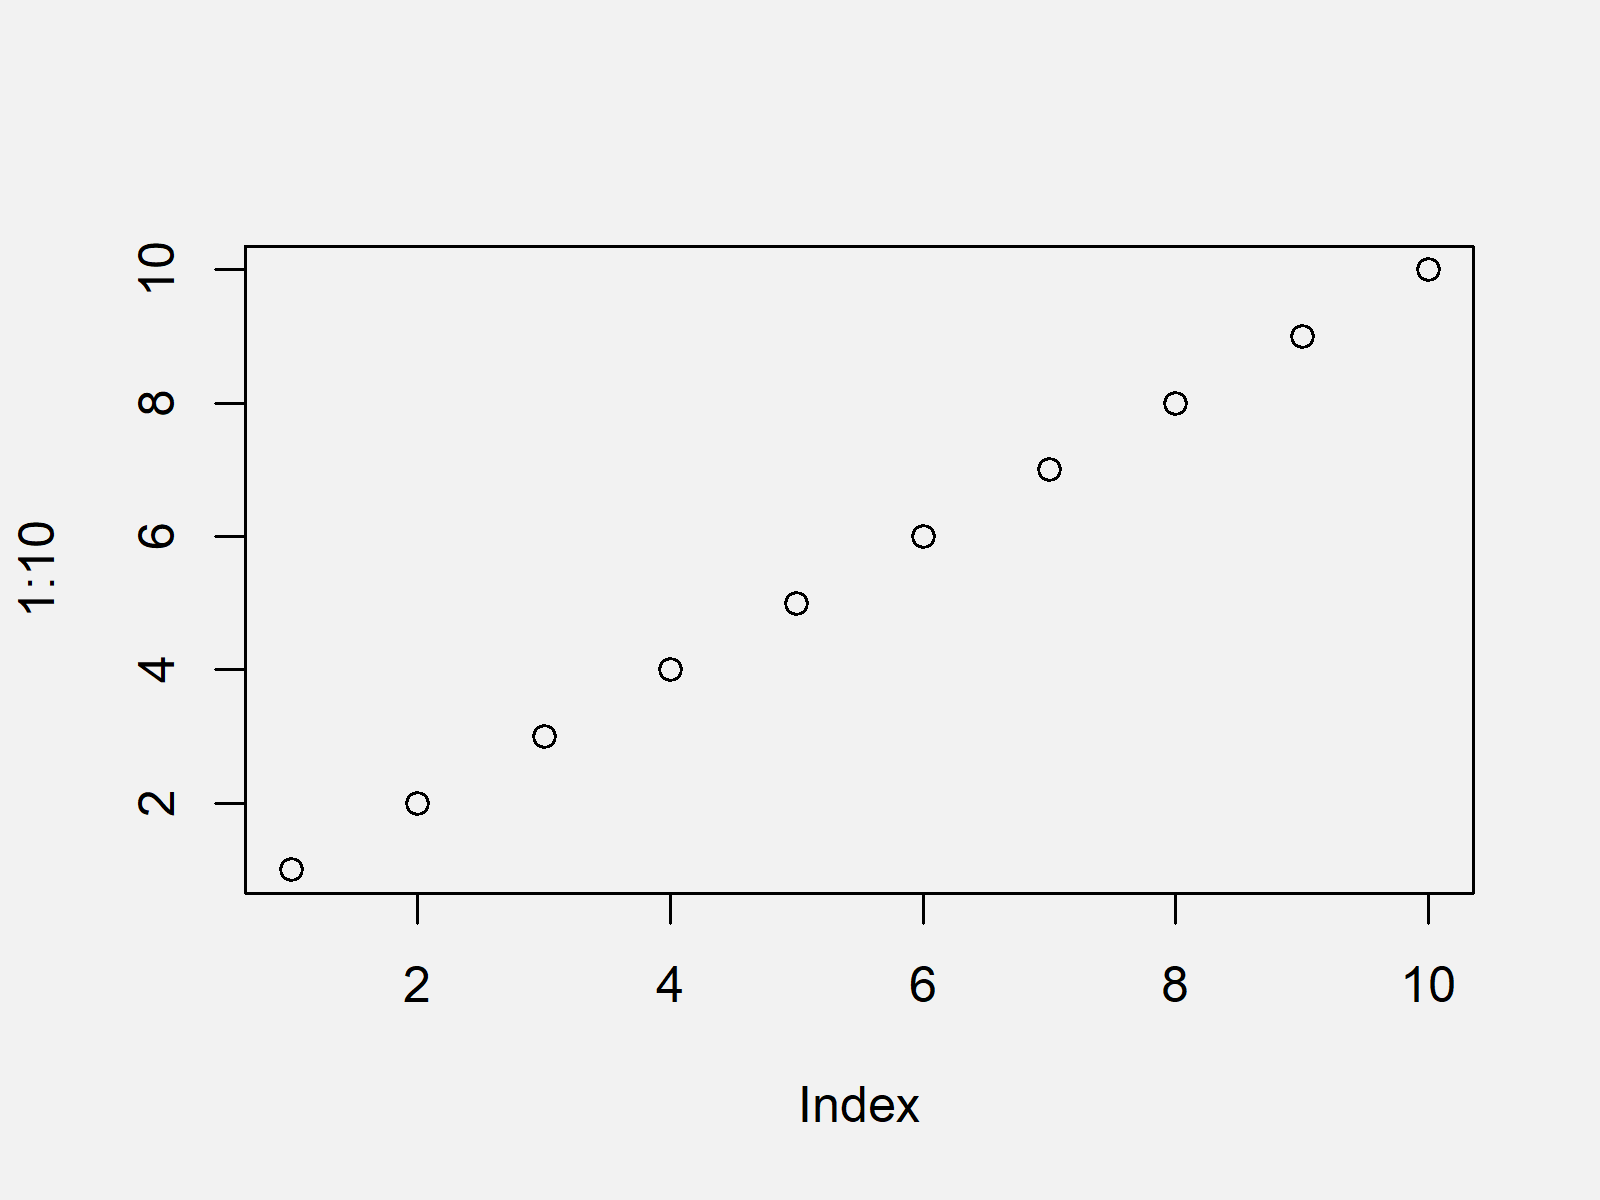
The output of the previous R programming syntax is shown in Figure 2 – As you can see, the par options were set back to default values (i.e. additional white space was removed).
Video, Further Resources & Summary
In case you need further information on the R code of this article, you might want to watch the following video of my YouTube channel. In the video, I show the R programming code of this tutorial.
The YouTube video will be added soon.
Furthermore, I can recommend to have a look at the other tutorials on this homepage. I have released several posts already:
You learned in this article how to reset par in the R programming language. Let me know in the comments below, in case you have additional questions. Furthermore, don’t forget to subscribe to my email newsletter to get updates on new articles.


