R Error: Invalid Graphics State (2 Examples)
This page illustrates how to handle the “invalid graphics state” error message in the R programming language.
The article contains the following content:
Let’s dive right into the exemplifying R code.
Introduction of Example Data
First, we’ll need to create some example data:
data <- data.frame(x1 = 8:3,    # Create example data
                   x2 = 2:7)
data                            # Print example data
#   x1 x2
# 1  8  2
# 2  7  3
# 3  6  4
# 4  5  5
# 5  4  6
# 6  3  7
Have a look at the previous output of the RStudio console. It shows that our example data has six rows and two numeric columns.
Example 1: Reproduce the Error: invalid graphics state
The following R syntax explains how to replicate the error message “invalid graphics state” in R.
This error message often occurs when we want to plot some data using the ggplot2 package.
In case we want to use the functions of the ggplot2 add-on package, we first need to install and load ggplot2:
install.packages("ggplot2")     # Install ggplot2 package
library("ggplot2")              # Load ggplot2
Now, we might try to create a ggplot2 graphic as follows:
ggplot(data, aes(x1, x2)) +     # Try to create plot
  geom_point()
# Error in .Call.graphics(C_palette2, .Call(C_palette2, NULL)) :
#   invalid graphics state
This code may sometimes work perfectly fine. However, it might happen that the error message “invalid graphics state” is returned.
This can happen due to multiple reasons. However, usually you have tried to plot any other data before or you might have changed some plotting parameters using R codes such as par and mfrow. This is affecting the new plot that we want to create now.
So how can we solve the problems with this error message? That’s what I’ll explain next!
Example 2: Fix the Error: invalid graphics state
In this example, I’ll explain how to avoid the error “invalid graphics state”. For this, we have to run the dev.off() function first:
dev.off() # Applying dev.off() function
After running the dev.off function, we can run the code for our plot again. Usually, this should work now:
ggplot(data, aes(x1, x2)) +     # Draw plot
  geom_point()

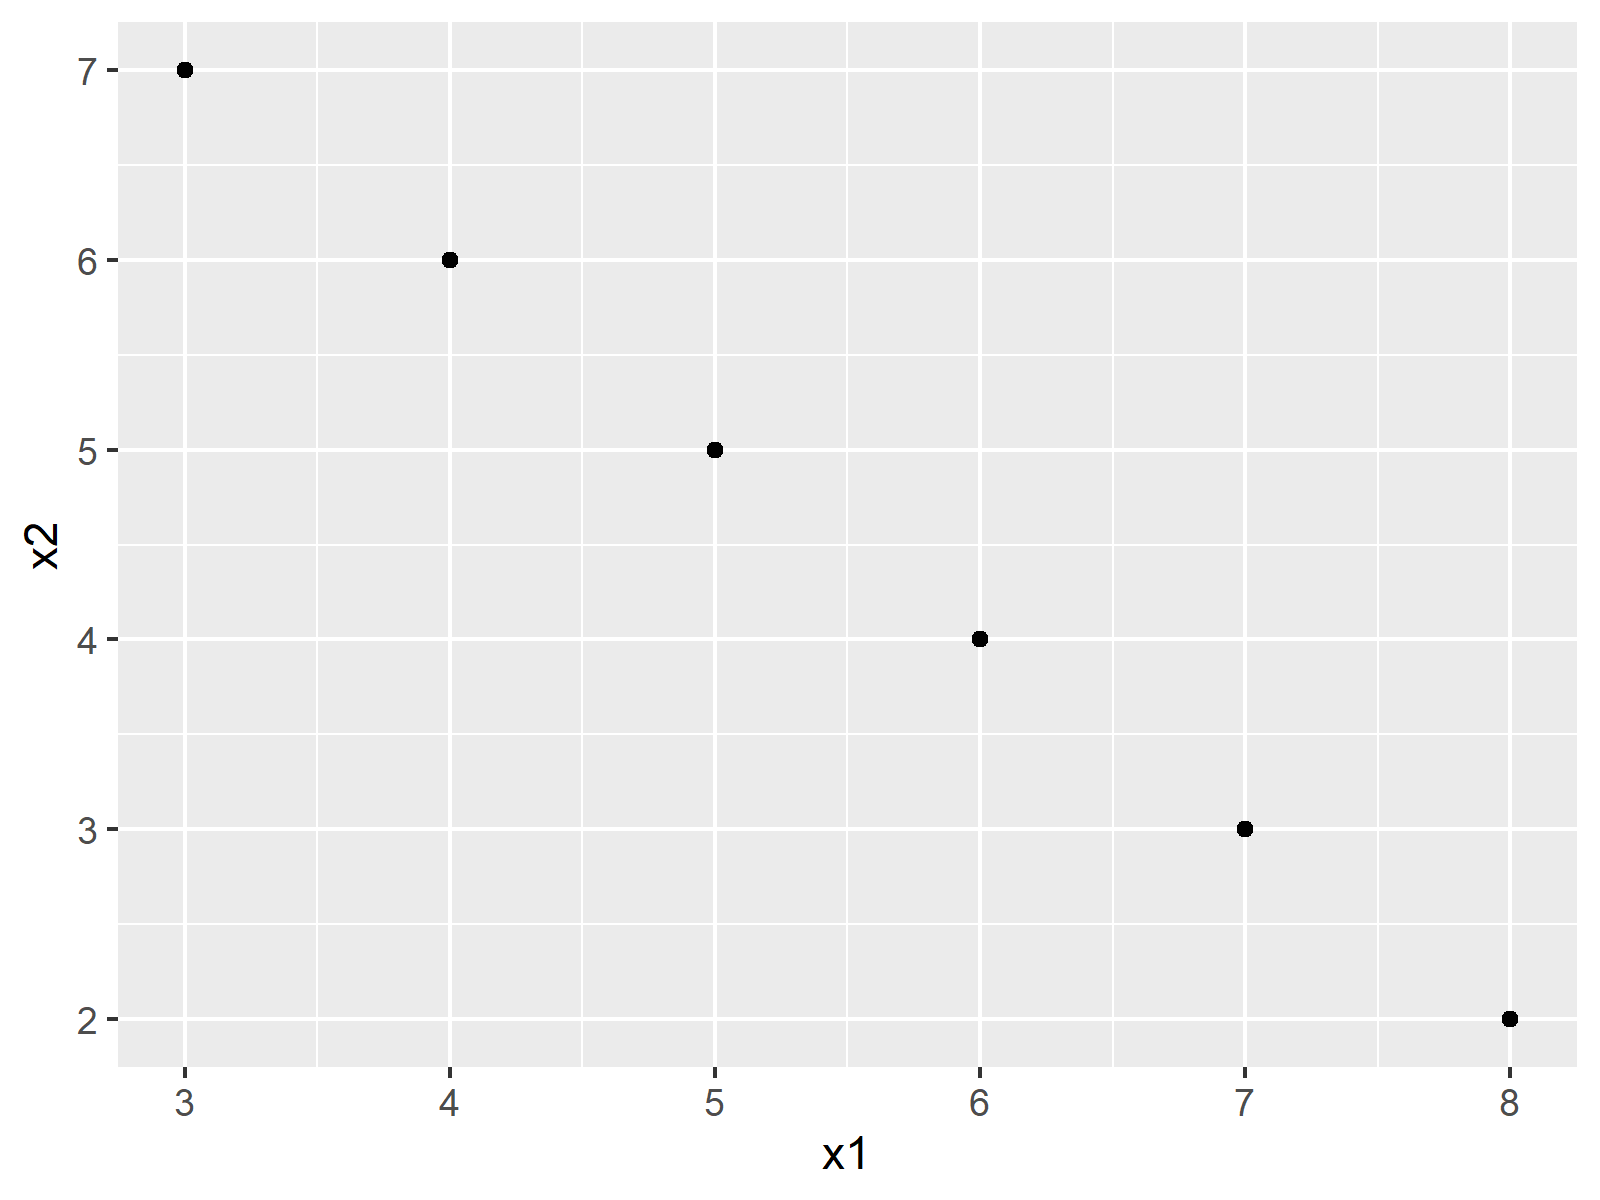
Figure 2 shows the output of the previous syntax: A ggplot2 scatterplot.
Video & Further Resources
If you need further explanations on the R programming syntax of this article, I can recommend to have a look at the following video of my YouTube channel. In the video, I’m explaining the R programming codes of this tutorial.
The YouTube video will be added soon.
In addition, you may have a look at the other articles of my website. You can find a selection of posts below.
Summary: At this point of the article you should have learned how to deal with the error message “invalid graphics state” in the R programming language. Let me know in the comments below, in case you have additional questions.


