Subset Data Frame Rows Based On Factor Levels in R (2 Examples)
On this page, I’ll show how to select certain data frame rows based on the levels of a factor column in the R programming language.
The tutorial is structured as follows:
Let’s dive right in:
Creation of Example Data
I use the data below as basement for this R programming tutorial:
data <- data.frame(x1 = factor(c("A", "B", "A", "C", "D", "B")),  # Create data frame
                   x2 = 1:6)
data                                                              # Print data frame

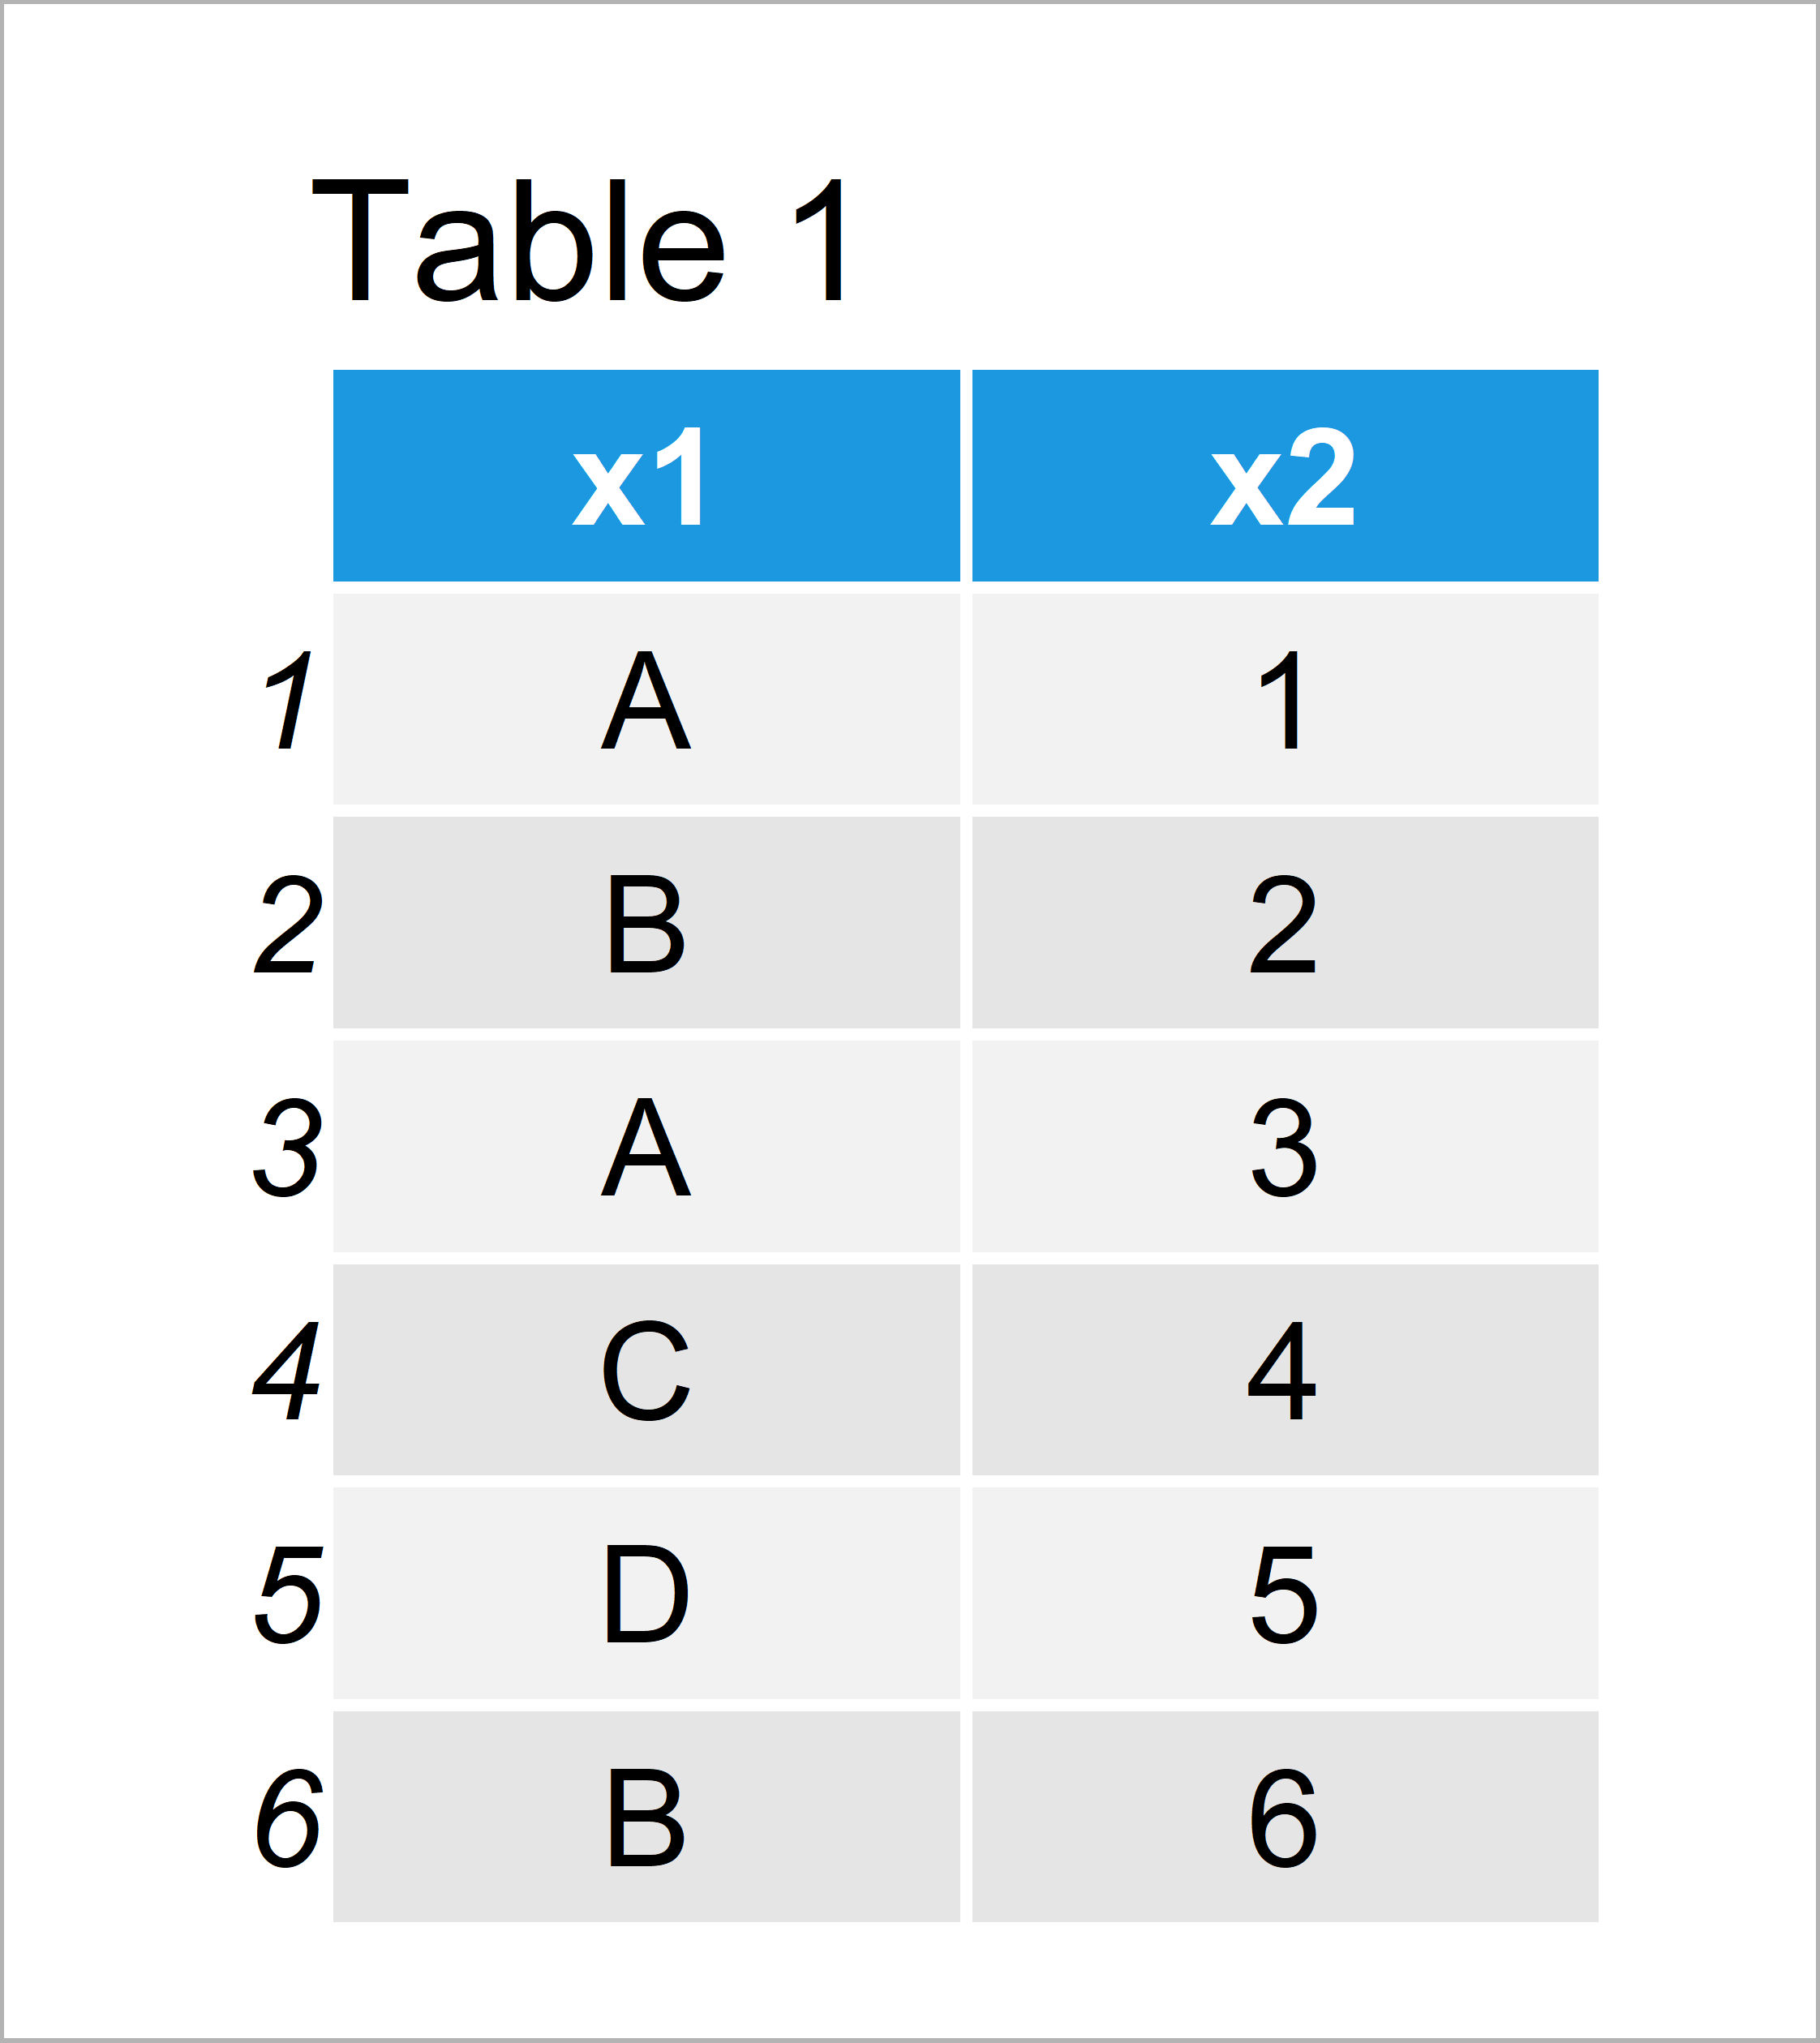
Table 1 shows the structure of our example data – It contains six observations and two variables. The column x1 is a factor with four different factor levels.
Example 1: Extracting Data Frame Rows Based On One Factor Level
In this example, I’ll show how to retain the rows where our factor column has one specific factor level.
For this, we can use the $ and == operators as shown below:
data_new1 <- data[data$x1 == "A", ]                               # One factor level
data_new1                                                         # Print updated data

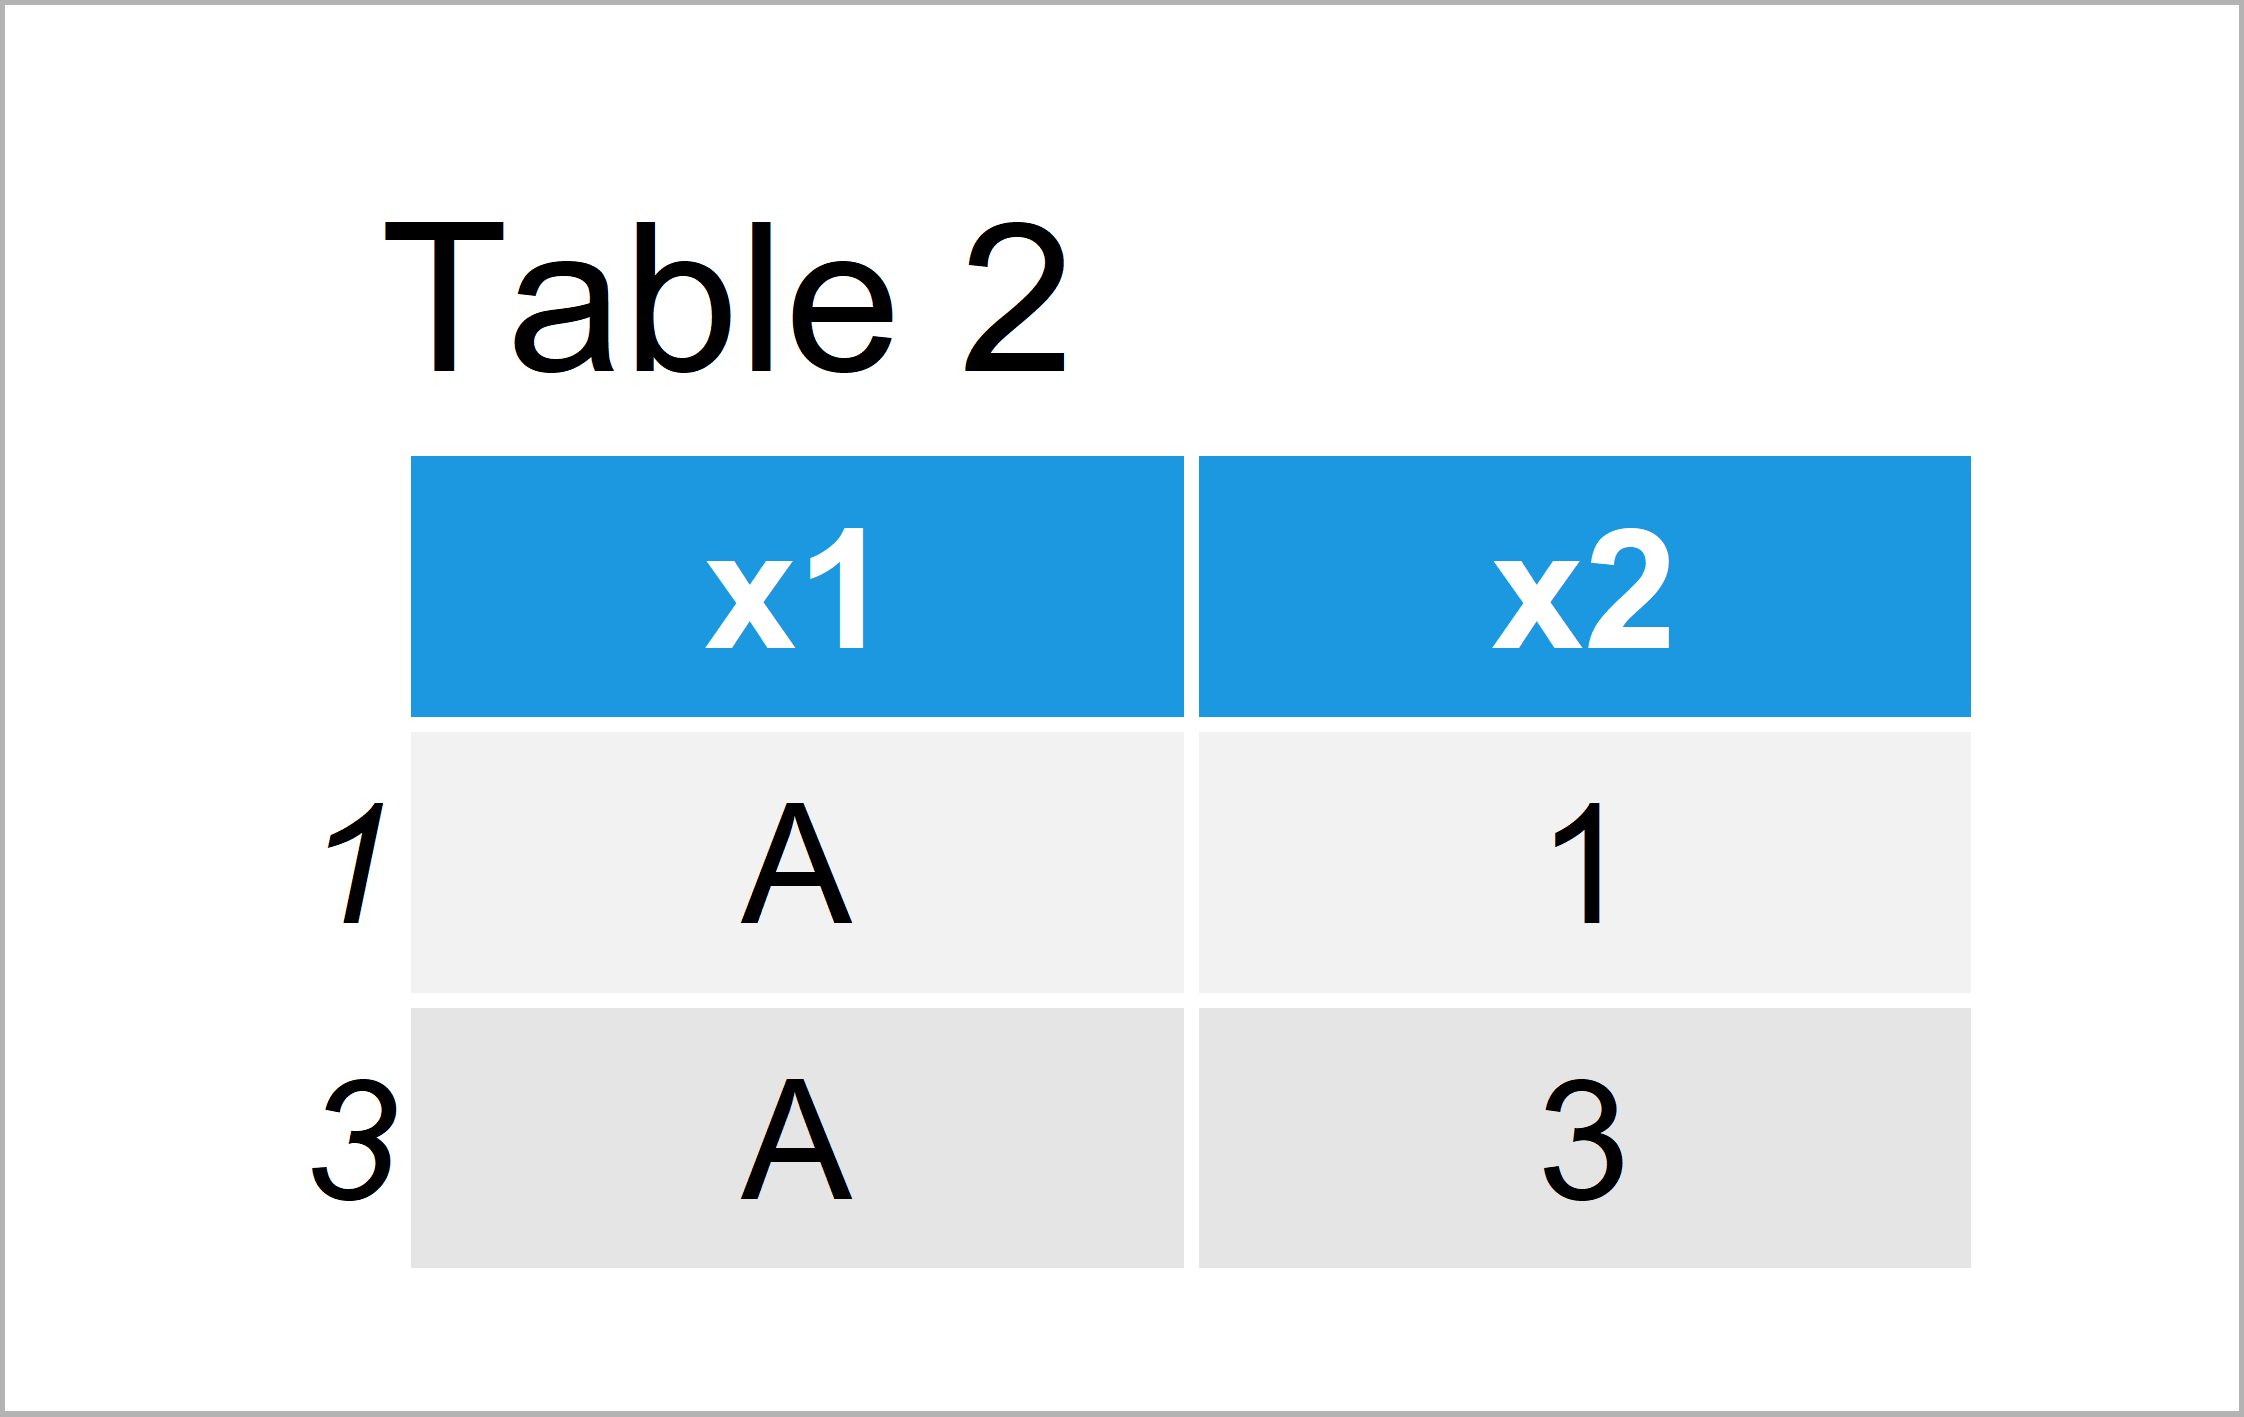
The output of the previous R programming code is shown in Table 2 – We have kept only those data frame rows where the variable x1 contains the factor level “A”.
Example 2: Extracting Data Frame Rows Based On Multiple Factor Levels
In this example, I’ll explain how to select data frame rows by multiple factor levels.
The following R syntax keeps rows where the factor column x1 has either the factor level “A” or the factor level “D”:
data_new2 <- data[data$x1 %in% c("A", "D"), ]                     # Multiple factor levels
data_new2                                                         # Print updated data

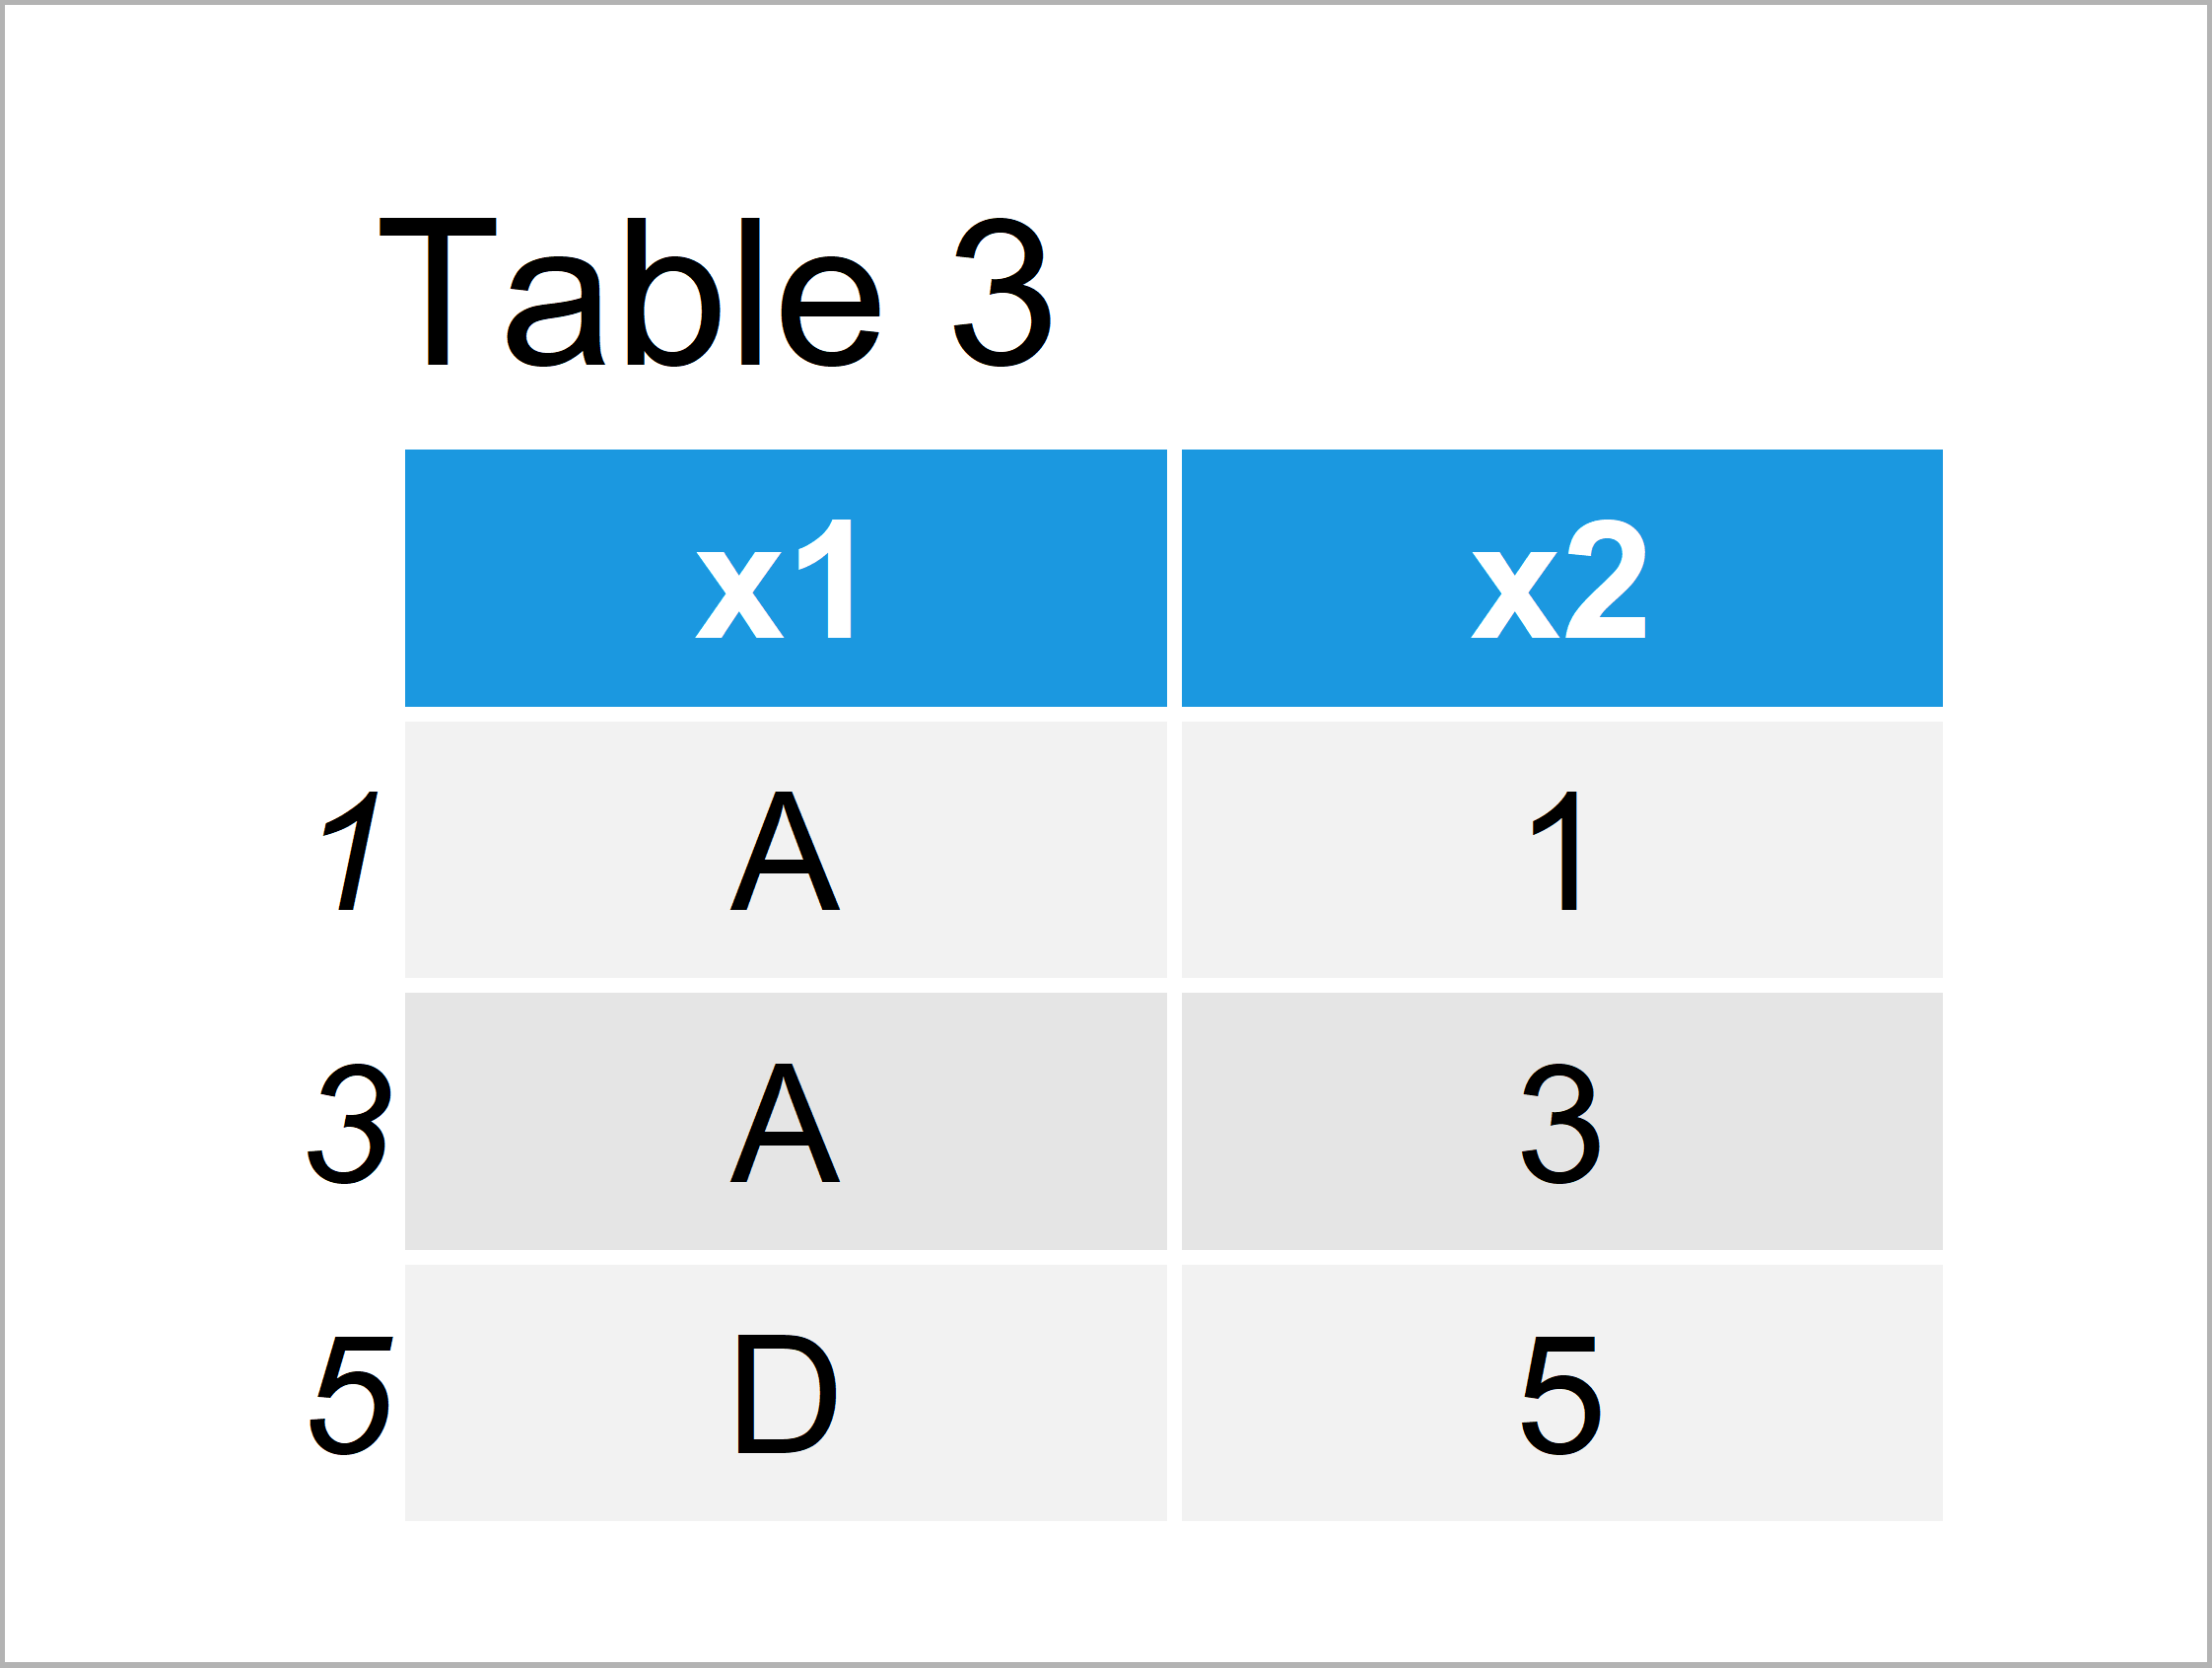
Table 3 shows the output of the previous code – A data frame with three rows. All of these rows have either the level “A” or “D” in the variable x1.
Video, Further Resources & Summary
If you need further explanations on the R codes of this article, I recommend having a look at the following video of my YouTube channel. In the video instruction, I show the R codes of this page in a live programming session in RStudio:
In addition, you might want to read some of the related articles on https://statisticsglobe.com/:
- Select Data Frame Rows based on Values in Vector
- droplevels R Example
- Subset Data Frame Rows by Logical Condition in R
- Extract Subset of Data Frame Rows Containing NA
- Unique Rows of Data Frame Based On Selected Columns
- R Programming Examples
In summary: This tutorial has illustrated how to extract rows according to factor levels in the R programming language. If you have further questions, tell me about it in the comments section below.


