repeat-Loop in R (2 Examples) | Writing & Running repeat-Statements
In this tutorial, I’ll explain how to write and run a repeat-loop in R.
The post will consist of the following content blocks:
Theoretical Workflow of repeat-Loops
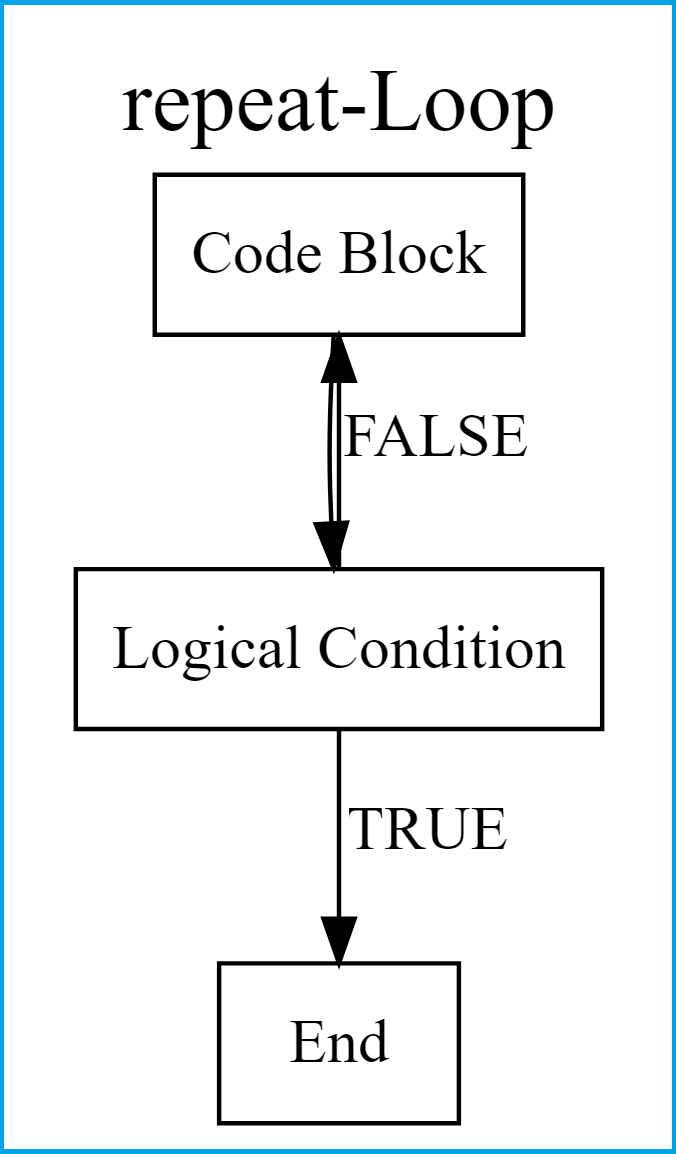
As a first step, let’s have a look at the workflow of repeat-loops:

As you can see in the previous Figure, repeat-loops start with a code block were some data manipulation or any other programming task is done. Then, it is checked whether a logical condition is met.
If this logical condition is TRUE, the break function stops the repeat-loop. If the logical condition is FALSE, the code block is run again.
Example 1: Writing a repeat-Loop in R (Basics)
The following R code illustrates how to use and run a repeat-loop in RStudio. First, we have to create a data object that we can use in the repeat-loop later on:
x <- 5                              # Specify example data object
x                                   # Print data object
# 5
Our example data object is called x and contains the value 5. Now, let’s write a repeat-loop that adds plus 1 to this data object until we reach a value of 10 or larger than 10:
repeat{                             # Starting repeat-loop

  x <- x + 1                        # Main code block of repeat-loop
  print(x)                          # Printing output

  if(x >= 10) {                     # Logical condition of repeat-loop

    break                           # Stopping repeat-loop
  }
}
# [1] 6
# [1] 7
# [1] 8
# [1] 9
# [1] 10
Above, you can see the R syntax and the output of the repeat-loop. The repeat-loop had five iterations before the break condition was fulfilled.
Example 2: Running repeat-Loop Over Data Frame Columns
In Example 2, I’ll explain how to run a repeat-loop through the columns of a data frame. Let’s load some example data:
data(iris)                          # Loading exemplifying data frame
head(iris)                          # Head of example data
#   Sepal.Length Sepal.Width Petal.Length Petal.Width Species
# 1          5.1         3.5          1.4         0.2  setosa
# 2          4.9         3.0          1.4         0.2  setosa
# 3          4.7         3.2          1.3         0.2  setosa
# 4          4.6         3.1          1.5         0.2  setosa
# 5          5.0         3.6          1.4         0.2  setosa
# 6          5.4         3.9          1.7         0.4  setosa
Let’s also define a running index that we can use within the repeat statement later on:
i <- 0 # Create running index
Let’s go:
repeat{                             # Start

  i <- i + 1                        # Update running index

  if(!is.numeric(iris[ , i])) {     # Break condition

    break
  }

  iris[ , i] <- iris[ , i] + 100    # Change data
}
Within the previous R code we added plus 100 to each numeric variable of our data frame until we hit the first non-numeric column. Let’s have a look at the updated data:
head(iris)
#   Sepal.Length Sepal.Width Petal.Length Petal.Width Species
# 1        105.1       103.5        101.4       100.2  setosa
# 2        104.9       103.0        101.4       100.2  setosa
# 3        104.7       103.2        101.3       100.2  setosa
# 4        104.6       103.1        101.5       100.2  setosa
# 5        105.0       103.6        101.4       100.2  setosa
# 6        105.4       103.9        101.7       100.4  setosa
All numeric values were increased by 100.
Video, Further Resources & Summary
Some time ago I have released a video on my YouTube channel, which shows the R programming code of this tutorial. You can find the video below.
The YouTube video will be added soon.
Furthermore, you might want to have a look at the related articles of my homepage:
- break & next Functions in R for-loop
- for-Loop in R
- while-Loop in R
- Loops in R
- The R Programming Language
Summary: In this tutorial, I showed how to use repeat-loops in the R programming language. Let me know in the comments section, in case you have any further questions.


