Set Area Margins of ggplot2 Plot in R (Example)
In this R programming tutorial you’ll learn how to change the area margins of a ggplot2 graph.
Table of contents:
You’re here for the answer, so let’s get straight to the exemplifying R syntax.
Example Data, Add-On Packages & Basic Plot
Let’s first construct some example data in R:
data <- data.frame(x = 1:10,        # Example data
                   y = 1:10)
data                                # Show data in console
#     x  y
# 1   1  1
# 2   2  2
# 3   3  3
# 4   4  4
# 5   5  5
# 6   6  6
# 7   7  7
# 8   8  8
# 9   9  9
# 10 10 10
Have a look at the previous output of the RStudio console. It shows that our example data has ten rows and two columns.
We also need to install and load the ggplot2 package, if we want to use the functions that are included in the package.
install.packages("ggplot2")         # Install ggplot2 package
library("ggplot2")                  # Load ggplot2 package
Now, we can create a plot of our data as shown below:
ggp <- ggplot(data, aes(x, y)) +    # ggplot2 with default margins
  geom_point()
ggp                                 # Draw plot

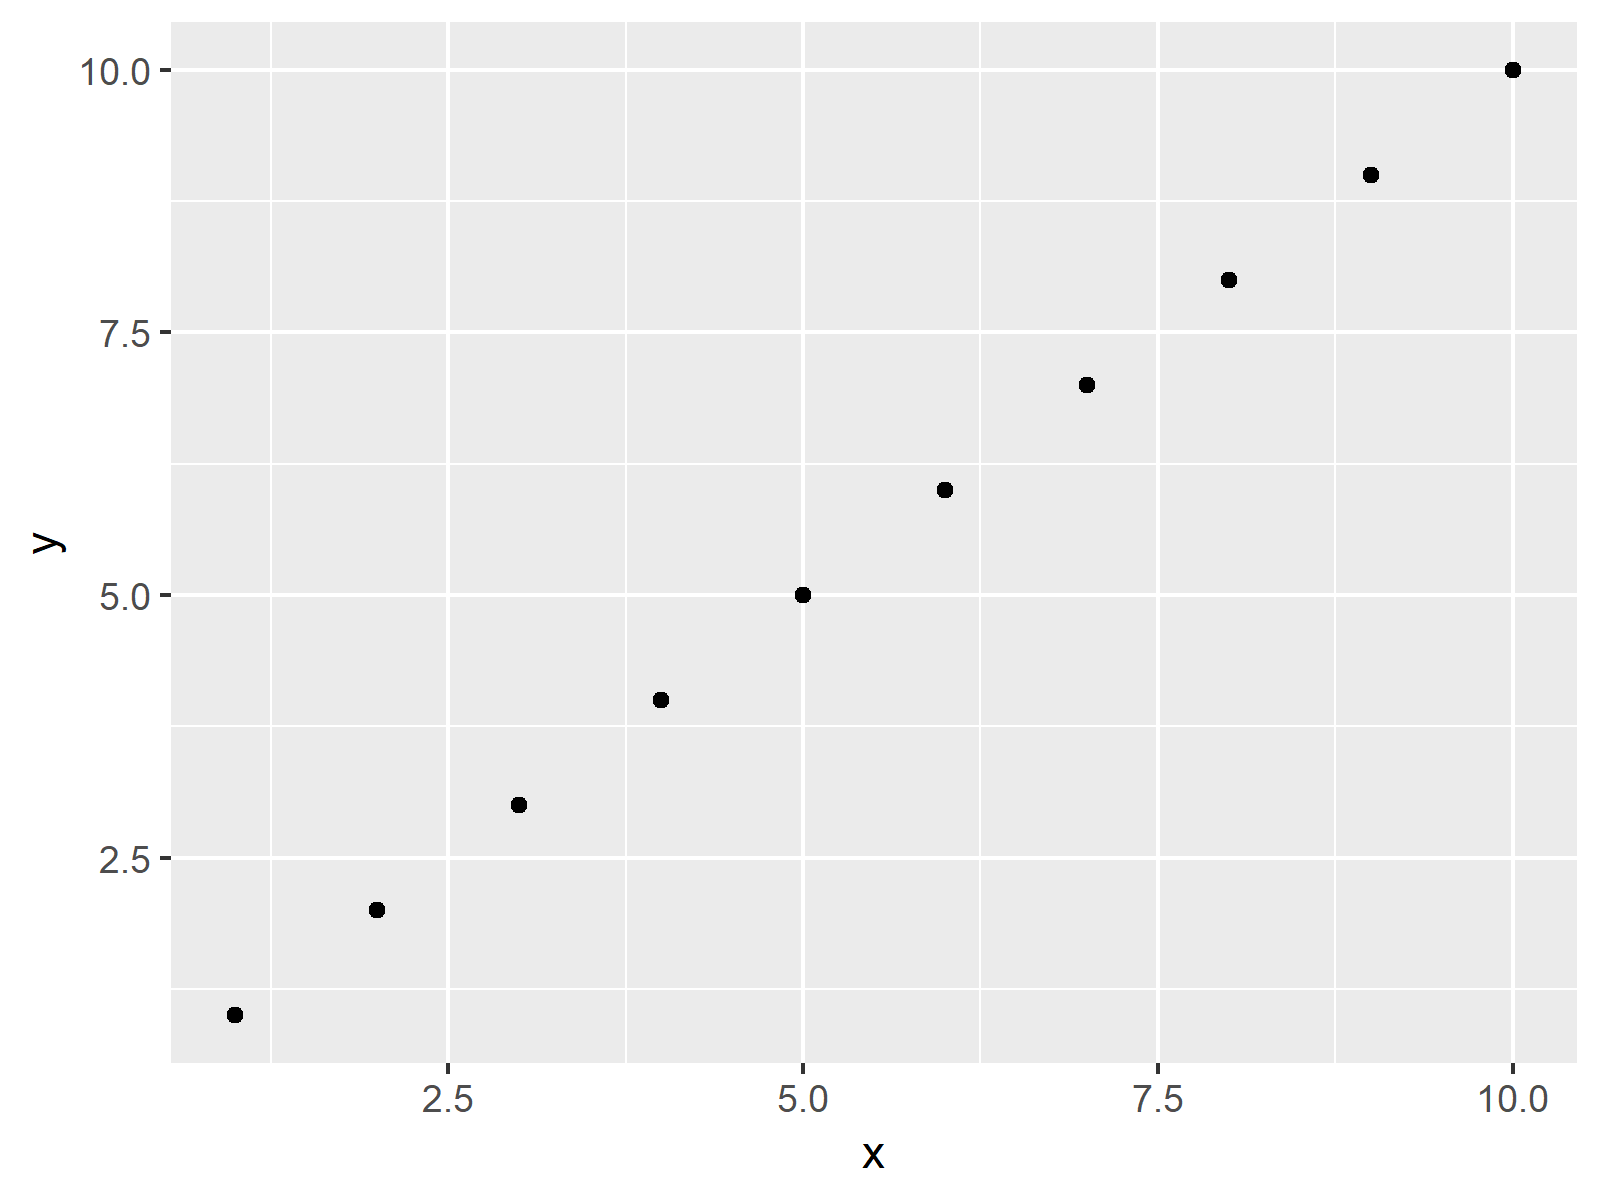
As you can see in Figure 1, we created a scatterplot with default plot margins with the previous R programming code.
Example: # Changing ggplot2 Margins Using theme Function & plot.margin Argument
In this Example, I’ll show how to modify (i.e. increase or decrease) the white space around a ggplot2 plot in R. In the following R code, we are using the theme function and the plot.margin argument to set the surrounding area around the plot to 3 cm on each side:
ggp +                               # Change margins of ggplot2 plot
  theme(plot.margin = unit(c(3, 3, 3, 3), "cm"))

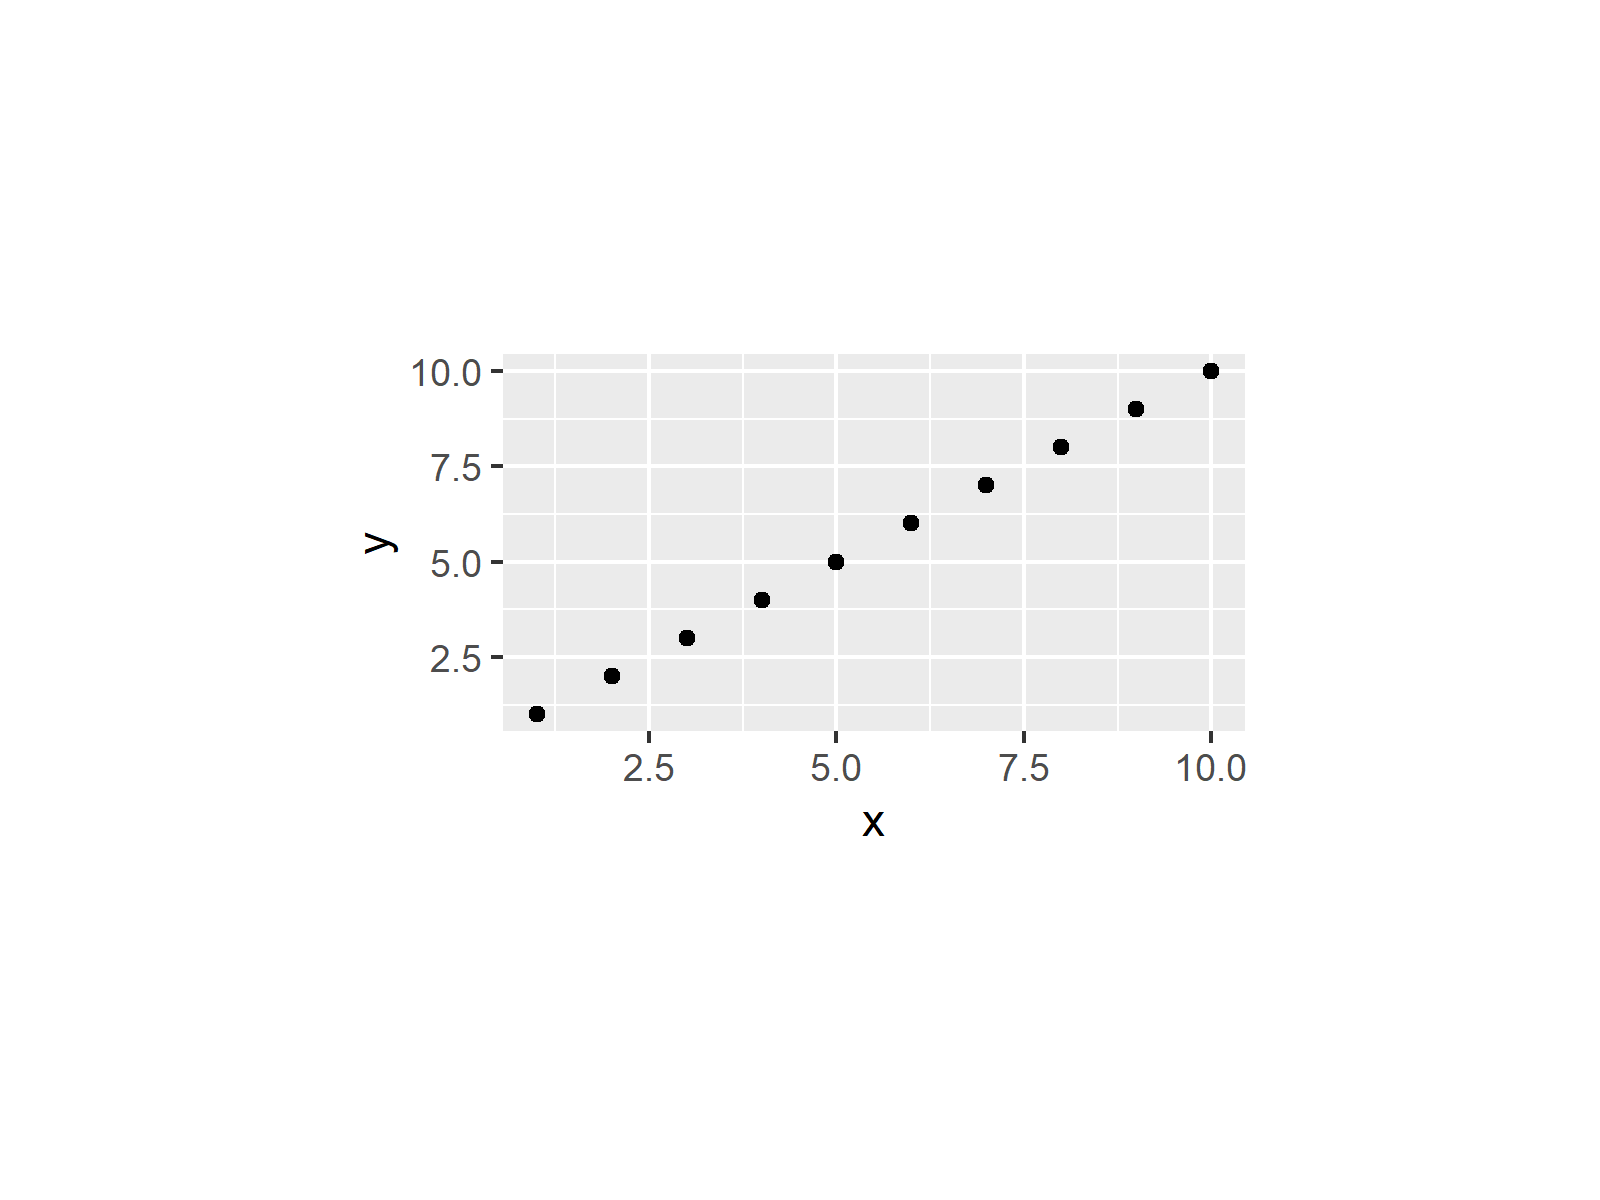
Figure 2 reveals the output of the previous R code: As expected, the same plot as before but with more space around the plot.
Video, Further Resources & Summary
Have a look at the following video of my YouTube channel. I show the contents of this tutorial in the video instruction:
Additionally, you may want to read the related articles of this homepage, if you are interested in setting options of ggplots manually. You can find some tutorials about the modification of ggplot2 plots here:
- Draw Unbalanced Grid of ggplot2 Plots in R
- Change Position of ggplot Title
- Remove Grid, Background Color, Top & Right Borders from ggplot2 Plot
- R Graphics Gallery
- The R Programming Language
Summary: At this point you should have learned how to adjust the white space around a ggplot2 graphic to remove or add additional space in the R programming language. If you have further questions, don’t hesitate to let me know in the comments.


