Remove Legend in ggplot2 (3 Example Codes) | Delete One or All Legends
This tutorial shows how to remove legends in plots of the R ggplot2 package. The article is structured as follows:
- Creating Example Data
- Hide All Legends in ggplot2 (Example 1)
- Remove One Specific Legend with guides command (Example 2a)
- Remove One Specific Legend with legend.off (Example 2b)
- Further Resources for the Formatting of ggplot2 plots
Let’s dive right in!
Create Example Data
Let’s first create an example data frame, which we can use in the examples later on:
set.seed(2468)                                                   # Set seed for reproducibility
data <- data.frame(x = c(rnorm(100, 1, 0.5), rnorm(20, 3, 0.3)), # Create x variable
                   y = c(rnorm(100, 1, 0.1), rnorm(20, 3, 1)),   # Ceate y variable
                   col12 = c(rep("col1", 100), rep("col2", 20)), # Create first color variable
                   col3 = "col3")                                # Create second color variable
head(data)                                                       # Print first 6 rows of data
#           x        y col12 col3
# 1 0.9530222 1.091612  col1 col3
# 2 0.8404038 1.082346  col1 col3
# 3 0.6221827 1.067994  col1 col3
# 4 1.2294909 1.006801  col1 col3
# 5 1.3508563 1.051379  col1 col3
# 6 0.1878442 1.015002  col1 col3
Our example data contains four columns, the first column contains the x-values; the second column contains the y-values; the third column contains the colors for the dots of our plot; and the fourth column contains the filling color for a regression line that we will draw to our graphic.
So let’s see how this data looks in ggplot2 by default. First, we need to install and load the ggplot2 package in R…
install.packages("ggplot2")                                      # Install ggplot2 package
library("ggplot2")                                               # Load ggplot2 package
…and then we can draw a scatterplot with corresponding regression line as follows:
my_ggplot <- ggplot(data, aes(x, y, group = col12)) +            # ggplot2 with 2 legends
  geom_point(aes(x, y, col = col12)) +
  geom_smooth(method = "lm", formula = y ~ x,
              aes(group = col3, fill = col3))
my_ggplot                                                        # Print plot with 2 legends

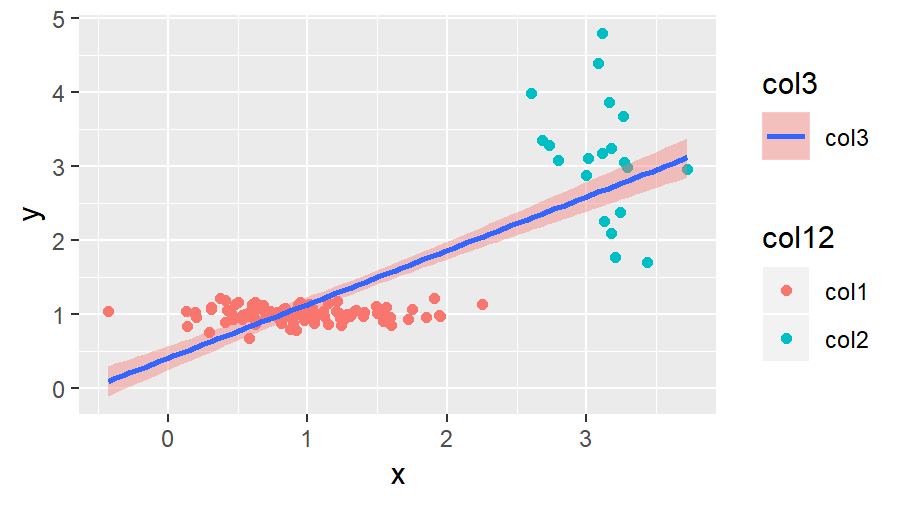
Figure 1: ggplot2 of Example Data with Two Legends.
As you can see in Figure 1, by default the previous R code prints two legends on the side of the dotplot.
In the following examples, I’ll show you how to delete one of these legends or how to switch off all legends. So let’s move on to the examples…
Example 1: Remove All Legends in ggplot2
If we want to remove all legends of our graph, we can use the following R syntax:
my_ggplot + theme(legend.position = "none") # Remove all legends from plot

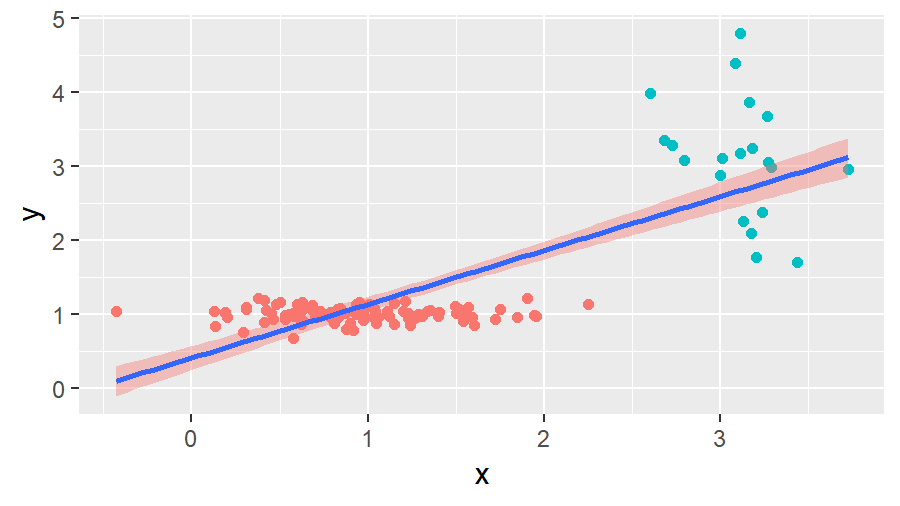
Figure 2: ggplot2 of Example Data without Legends.
We simply had to specify legend.position = “none” within the theme options to get rid of both legends.
But what if we want to keep one of the legends and remove the other? That’s what I’m going to show you next.
Example 2a: Hide One Specific Legend in ggplot2 with guides()
This example is called 2a, because there is an alternative solution that I will show you in the next example. However, in this example, we will remove one specific legend with the guides command.
The guides command can be used to specify an aesthetic, for which no legend should be shown.
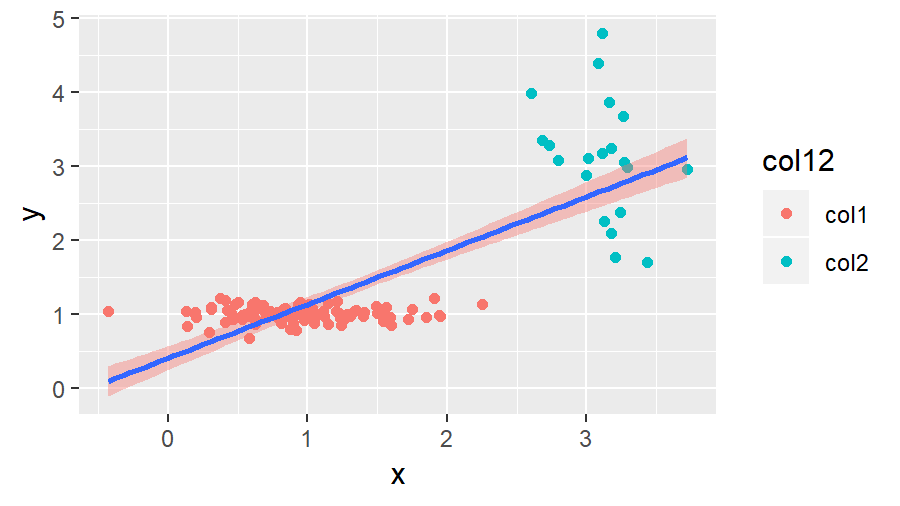
We can use the guides command to delete the legend for the fill aesthetic…
my_ggplot + guides(fill = FALSE) # Remove legend for aes fill

Figure 3: ggplot2 of Example Data with First Legend.
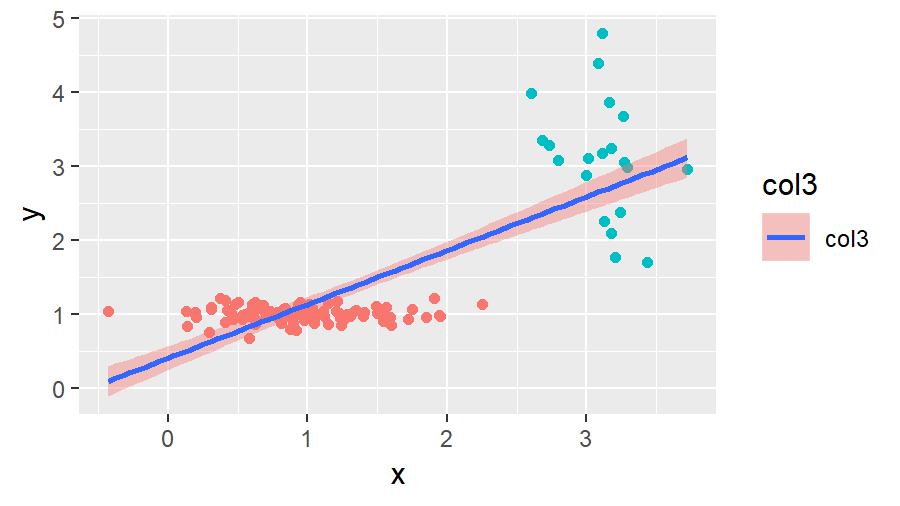
…or we can use guides to turn off the legend for the col aesthetic:
my_ggplot + guides(col = FALSE) # Remove legend for aes col

Figure 4: ggplot2 of Example Data with Second Legend.
Of cause, this kind of code could also be applied to other aesthetics as well as to other kinds of plots (histogram, barchart, QQplot etc.).
At this point, you have learned basically all things you need to know in order to remove legends in R ggplots. However, I want to show you another alternative, which can also be quite handy sometimes. So keep on reading…
Example 2b: Hide One Specific Legend in ggplot2 with show.legend
Another solution for removing legends in ggplots is the show.legend option. By default, this option is specified to be TRUE. We can modify this default value manually as follows to turn off the first legend…
my_ggplot_2b.1 <- ggplot(data, aes(x, y, group = col12)) +       # ggplot2 with 1 legend
  geom_point(aes(x, y, col = col12)) +
  geom_smooth(method = "lm", formula = y ~ x,
              aes(group = col3, fill = col3),
              show.legend = FALSE)                               # Remove second legend
my_ggplot_2b.1                                                   # Print plot with 1 legend
…and as follows to hide the second legend…
my_ggplot_2b.2 <- ggplot(data, aes(x, y, group = col12)) +       # ggplot2 with 1 legend
  geom_point(aes(x, y, col = col12),
             show.legend = FALSE) +                              # Remove first legend
  geom_smooth(method = "lm", formula = y ~ x,
              aes(group = col3, fill = col3))
my_ggplot_2b.2                                                   # Print plot with 1 legend
The output of these R codes is the same as in Example 2a.
Tutorial Video & Further Resources for ggplot2
On the Statistics Globe YouTube channel, you can also find a tutorial video, where I explain the content of this topic in some more detail:
The ggplot2 environment is very complex and might sometimes be difficult to understand. For that reason I can recommend to learn ggplot from scratch once, instead of struggling with it again and again. If you want to improve your ggplot2 skills, I can recommend the following YouTube video of the Data Science Dojo channel:
Furthermore, you may also have a look at the other R programming tutorials of this website. Here you can find some interesting reads:
- Change Text of ggplot2 Legend
- Create Legend in ggplot2 Plot
- Add Common Legend to Combined ggplot2 Plot
- Change Position of ggplot Title
- Graphics in R
- List of R Commands (+ Examples)
- The R Programming Language
In this tutorial I explained how to remove legends in ggplot2. The tutorial should include everything you need to know in order to delete a legend properly. However, in case you have any further questions or recommendations for improvements of the tutorial, you can let me know in the comments!


4 Comments. Leave new
Fantastic video! Thank you so much!
HI Illya,
Thanks for the kind response, we are glad to hear that you found the tutorial and the video helpful!
This is out of date:
“Warning message:
The “ argument of `guides()` cannot be `FALSE`. Use “none” instead as of ggplot2 3.3.4.
This warning is displayed once every 8 hours.
Call `lifecycle::last_lifecycle_warnings()` to see where this warning was generated. “
Hello Chris,
Thank you for the update. When such changes are made, the developers often provide warnings to help users migrate from old syntax or usage patterns to the new recommended ways. It is best to update your code as suggested.
Best,
Cansu