Ignore Outliers in ggplot2 Boxplot in R (Example)
In this article you’ll learn how to remove outliers from ggplot2 boxplots in the R programming language.
The article will contain one examples for the removal of outliers. To be more precise, the table of content looks like this:
- Introduction of Example Data
- Example: Remove Outliers from ggplot2 Boxplot
- Video & Further Resources
Let’s do this:
Introduction of Example Data
In this example, we’ll use the following data frame as basement:
data <- data.frame(y = c(runif(20), 5, - 3, 8)) # Create example data
Our data frame consists of one variable containing numeric values. Some of these values are outliers.
In order to draw plots with the ggplot2 package, we need to install and load the package to RStudio:
install.packages("ggplot2")                               # Install and load ggplot2
library("ggplot2")
Now, we can print a basic ggplot2 boxplot with the the ggplot() and geom_boxplot() functions:
ggplot(data, aes(y = y)) +                                # Create ggplot with outliers
  geom_boxplot()

Figure 1: ggplot2 Boxplot with Outliers.
As you can see based on Figure 1, we created a ggplot2 boxplot with outliers. Now, let’s remove these outliers…
Example: Remove Outliers from ggplot2 Boxplot
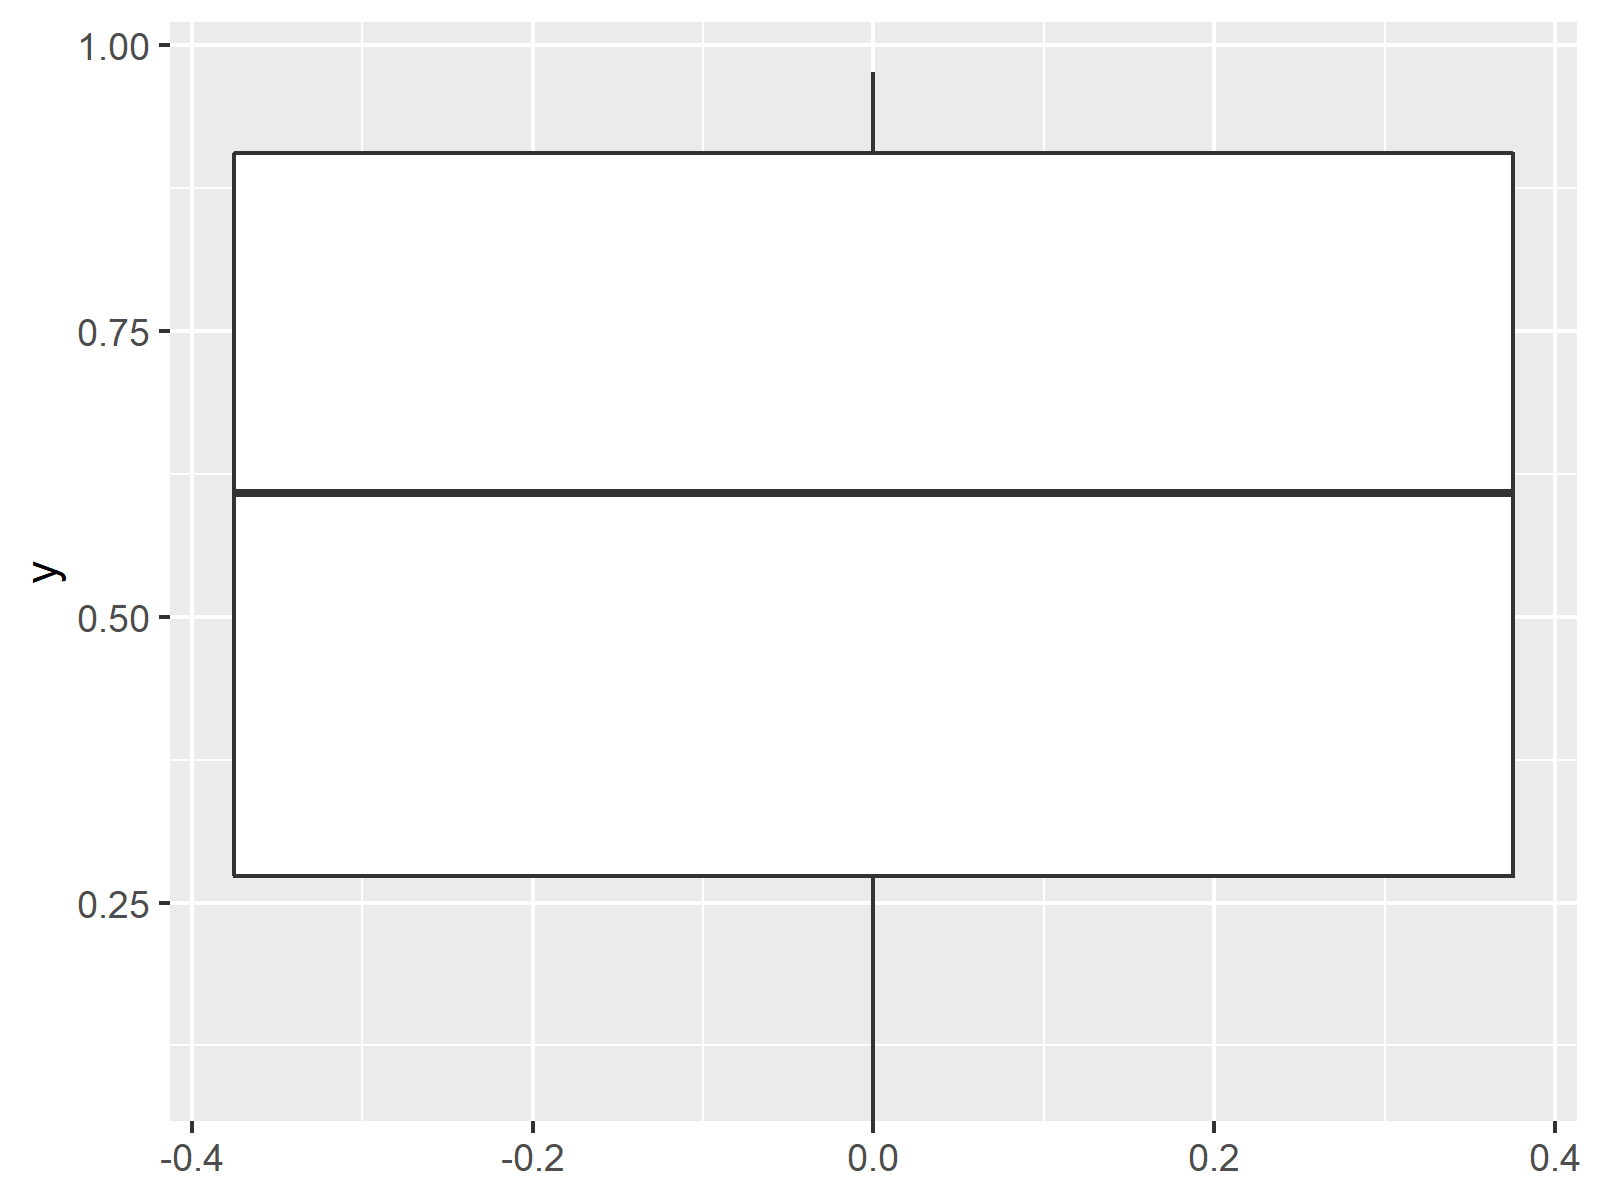
If we want to remove outliers in R, we have to set the outlier.shape argument to be equal to NA. Furthermore, we have to specify the coord_cartesian() function so that all outliers larger or smaller as a certain quantile are excluded. Have a look at the following R programming code and the output in Figure 2:
ggplot(data, aes(y = y)) +                                # Create ggplot without outliers
  geom_boxplot(outlier.shape = NA) +
  coord_cartesian(ylim = quantile(data$y, c(0.1, 0.9)))

Figure 2: ggplot2 Boxplot without Outliers.
As you can see, we removed the outliers from our plot. Note that the y-axis limits were heavily decreased, since the outliers are not shown anymore. You may set the y-axis limits to your personal preferences as shown in this tutorial.
Video & Further Resources
I have recently released a video on my YouTube channel, which illustrates the examples of this article. You can find the video below:
Furthermore, I can recommend to have a look at the other articles of my homepage. Some posts about ggplot and the axis limits of plots can be found below.
- Create a Box-and-Whisker Plot in R
- Set Axis Limits in ggplot2 R Plot
- R Graphics Gallery
- The R Programming Language
To summarize: At this point you should know how to ignore and delete outliers in ggplot2 boxplots in the R programming language. Don’t hesitate to tell me about it in the comments section below, in case you have further questions.


6 Comments. Leave new
Thanks.
Is it possible to ignore outliers only for one boxplot when we have 2 in the same figure. Let say one boxplot for observations and the other for simulations.
Hey Nicolas,
Thanks for the interesting question. One solution could be to show the two boxplots in different plot winows side-by-side as shown in this thread: https://stackoverflow.com/questions/41536406/how-to-apply-separate-coord-cartesian-to-zoom-in-into-individual-panels-of-a
I hope that helps!
Joachim
geom_boxplot(outlier.shape=NA) no longer works with the update apparently. is there another code to remove outliers from a boxplot?
Thanks!
Hi Erica,
Thanks a lot for the hint. For me the code still works though. Which versions of R and ggplot2 do you use?
Regards
Joachim
Is there a way to determine the value of the outliers removed?
Hi Nicole,
Yes this is possible using the following R code:
Please note that the determination of outliers is a very complex and controversial topic. In this example, we have simply defined all values as outliers that are smaller than the 1st decile and greater than the 9th decile. Depending on your data, other approaches might be more sufficient.
I hope that helps!
Joachim