ggplot2 Plot in Script is not Displayed in R (Example)
This tutorial shows how to show a ggplot2 graphic when running a script in the R programming language.
The tutorial consists of the following content blocks:
So without further additions, let’s do this!
Example Data, Add-On Packages & Default Plot
As a first step, let’s construct some exemplifying data:
data <- data.frame(x = 1:5,        # Example data
                   y = 1:5)
data                               # Show example data
#   x y
# 1 1 1
# 2 2 2
# 3 3 3
# 4 4 4
# 5 5 5
The previously shown output of the RStudio console shows that our example data has five rows and two numeric columns.
If we want to use the functions & commands of the ggplot2 package, we also have to install and load ggplot2:
install.packages("ggplot2")          # Install ggplot2 package
library("ggplot2")                   # Load ggplot2 package
Next, we may try to plot our data as shown below:
for(i in 1:3) {                    # for-loop creating ggplot2 plot

  if(i == 2) {

    ggp <- ggplot(data, aes(x, y)) +
      geom_point()
    ggp
  }
}
Surprise! Nothing happened! So why didn’t our ggplot2 plot show up? That’s what I’m going to explain next…
Example: Drawing ggplot2 Plot within for-Loop Using print Function
The following code shows how to return a ggplot2 plot within a long R programming script. If we want to draw a plot within a loop or a user-defined function, we can simply use the print() function to show our plot.
Run the following R syntax:
for(i in 1:3) {                    # for-loop creating ggplot2 plot

  if(i == 2) {

    ggp <- ggplot(data, aes(x, y)) +
      geom_point()
    print(ggp)                     # Explicit printing of plot
  }
}

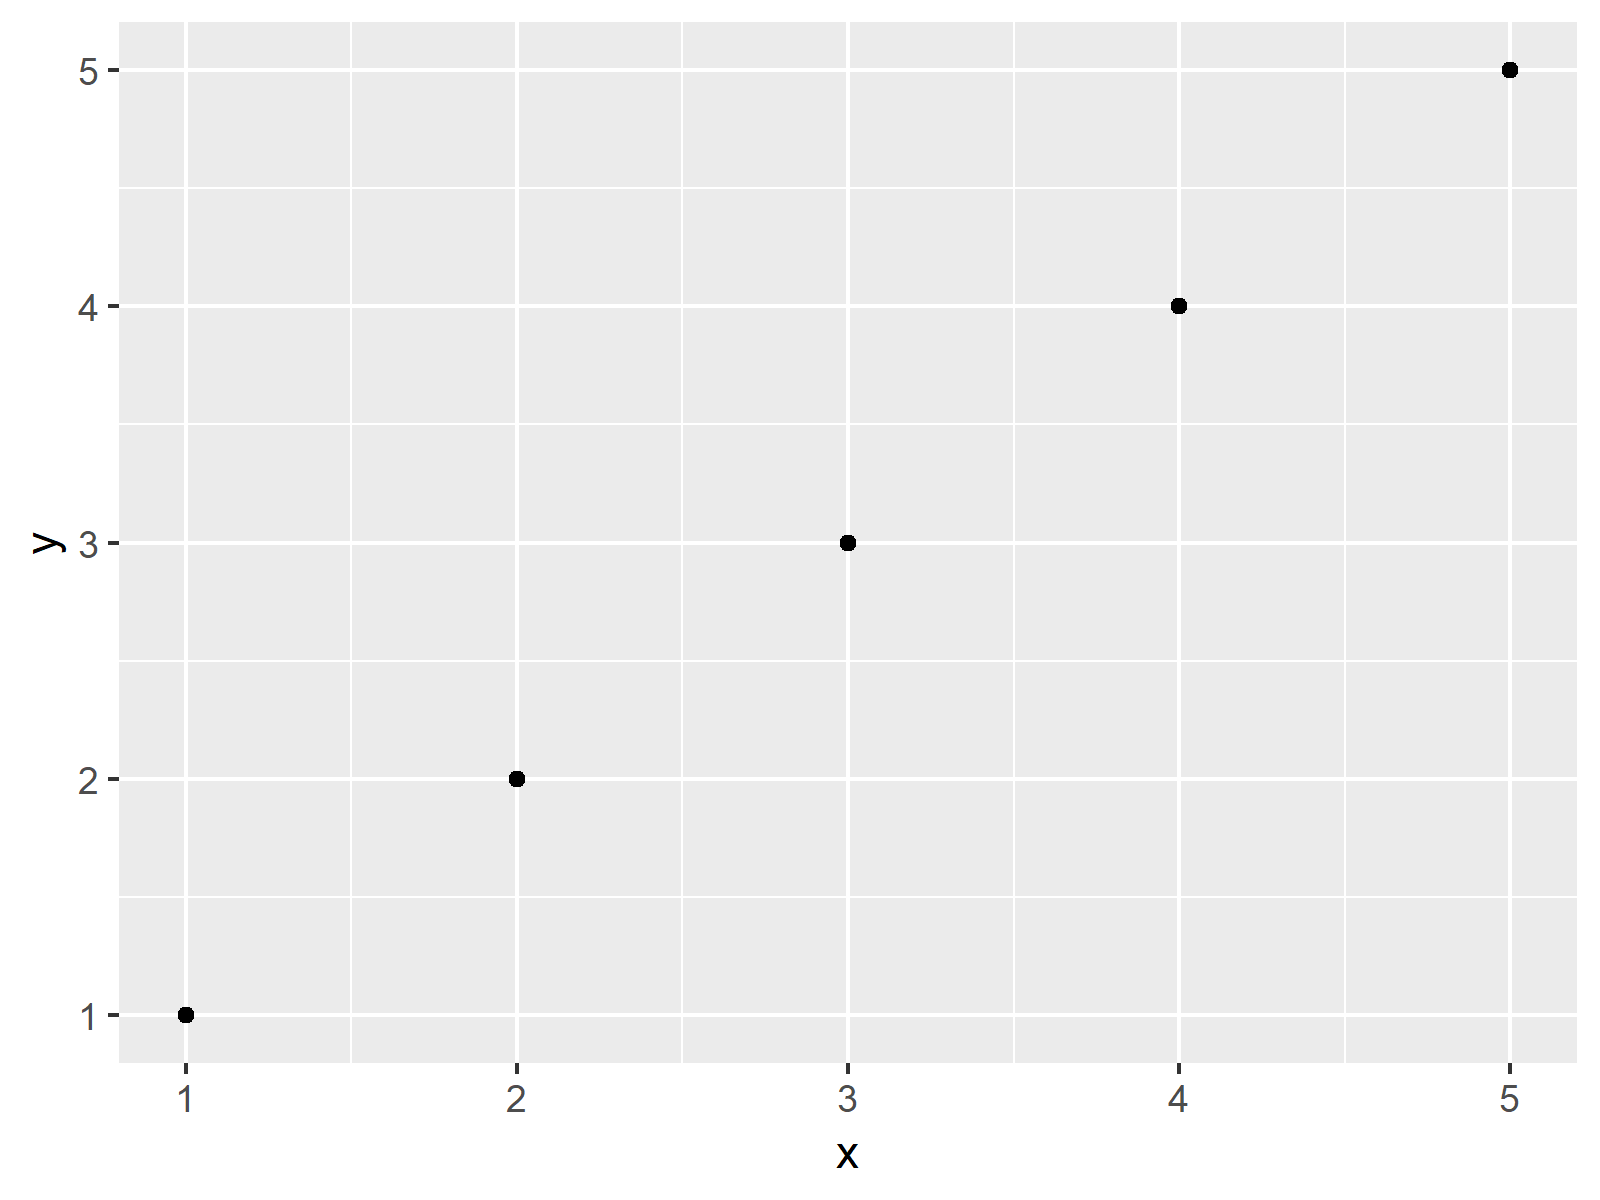
The output of the previous syntax is shown in Figure 1 – A ggplot2 scatterplot drawn within a for-loop with if-condition.
Video, Further Resources & Summary
Would you like to learn more about the ggplot2 package and its variety of functions, then please check out the video below, where you get a detailed introduction to the package and data visualization in R.
Besides that, you could read the related tutorials of this website:
Summary: You learned in this article how to display ggplot2 plots within a running script in R. If you have additional comments and/or questions, don’t hesitate to let me know in the comments section.


