How to Create an Empty Plot in R (2 Examples)
In this R tutorial you’ll learn how to draw an empty plot.
The article will contain this information:
- Example 1: Draw Empty Plot with plot.new Function
- Example 2: Manually Remove All Elements from Plot
- Video & Further Resources
So here’s how to do it!
Example 1: Draw Empty Plot with plot.new Function
If we want to create a new plot window, without showing any plot elements, axes, or values, we can use the plot.new function:
plot.new() # Create empty plot
After running the previous R code, you will see an empty plot window appearing at the bottom right in RStudio.
Example 2: Manually Remove All Elements from Plot
An alternative to the plot.new function is the manual removal of all elements from a plot. Have a look at the following R syntax:
plot(1, type = "n",                         # Remove all elements of plot
     xlab = "", ylab = "",
     xlim = c(0, 10), ylim = c(0, 10))

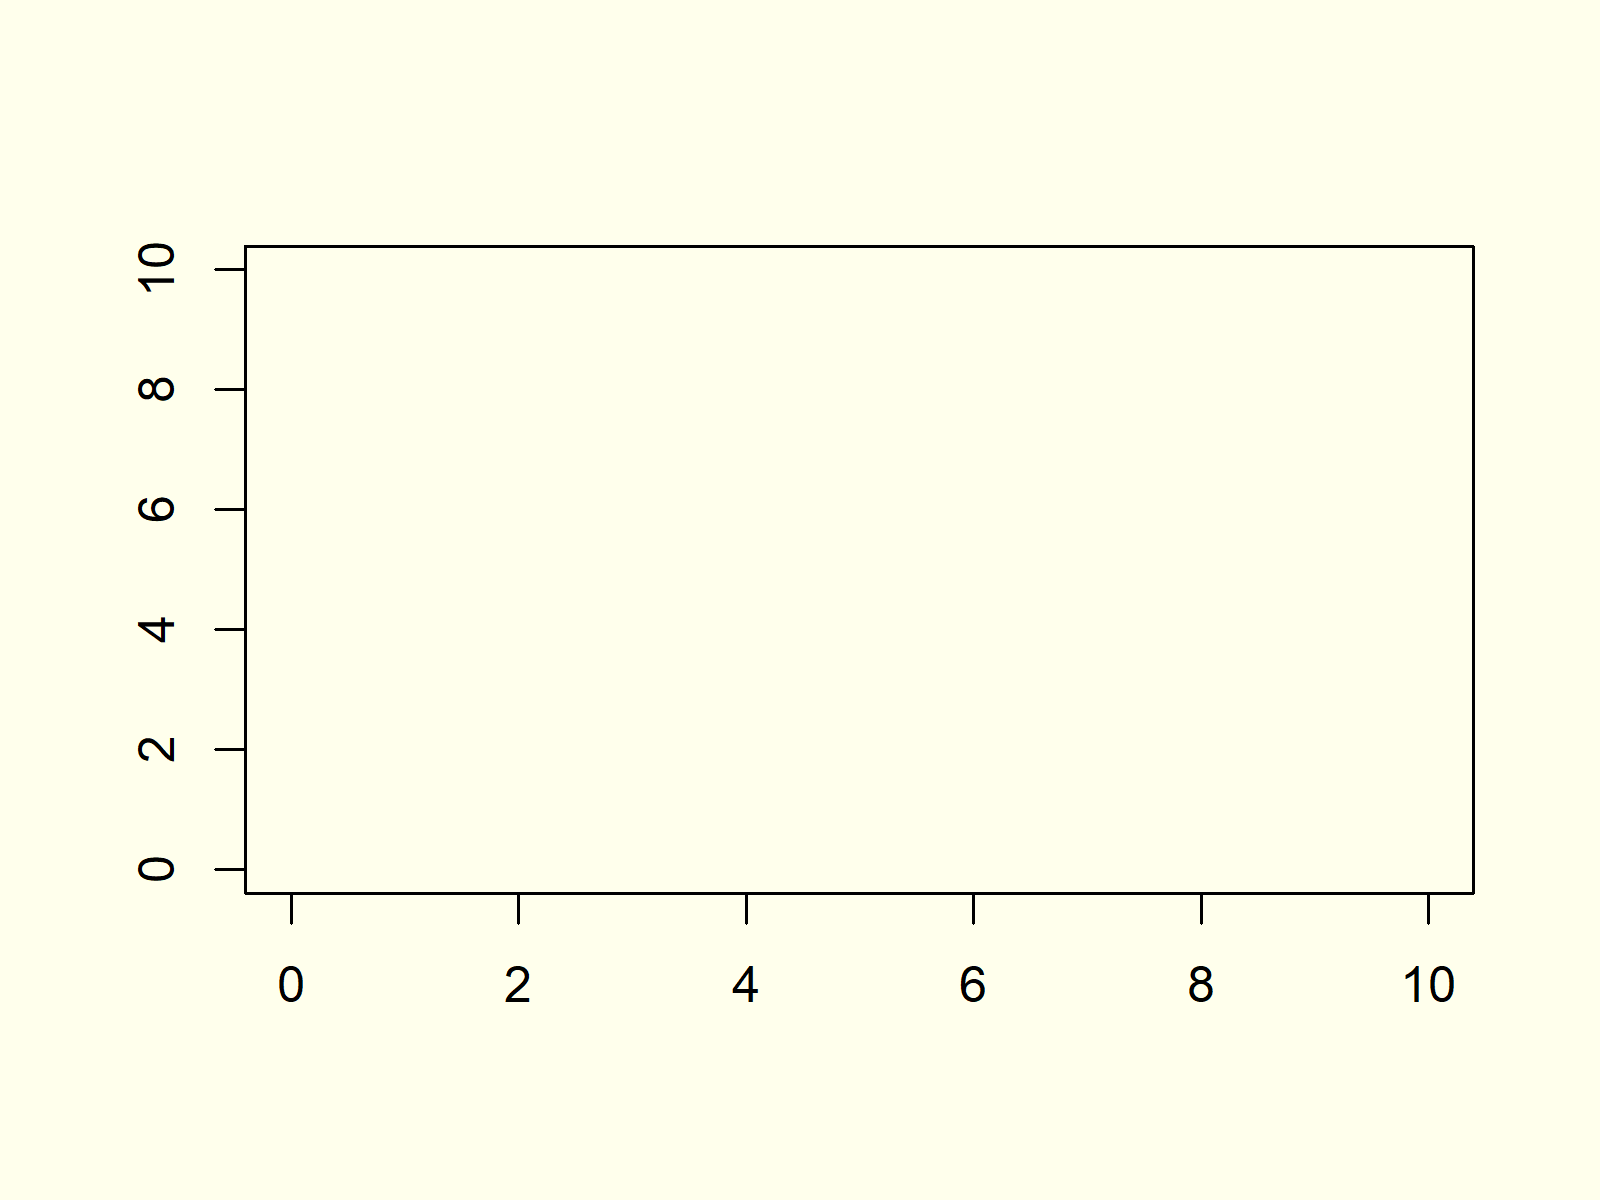
Figure 1: Empty Plot in R.
Figure 1 illustrates the output – An empty plot, which is only showing axis lines.
Video & Further Resources
Have a look at the following video of my YouTube channel. I’m explaining the R programming codes of this post in the video.
Furthermore, I can recommend to have a look at some of the related articles on this website. You can find a selection of articles about the plotting of data here:
In this tutorial you learned how to create a blank plot showing white space only in the R programming language. Let me know in the comments, in case you have additional questions.


