Bernoulli Distribution in R (4 Examples) | dbern, pbern, qbern & rbern Functions
In this R tutorial you’ll learn how to apply the Bernoulli distribution functions.
Table of contents:
- Example 1: Bernoulli Probability Density Function (dbern Function)
- Example 2: Bernoulli Cumulative Distribution Function (pbern Function)
- Example 3: Bernoulli Quantile Function (qbern Function)
- Example 4: Generating Random Numbers (rbern Function)
- Video, Further Resources & Summary
Let’s start right away.
Example 1: Bernoulli Probability Density Function (dbern Function)
In the first example, I’ll show you how to draw a plot of the probability density function (PDF) of the Bernoulli distribution.
The base installation of R does not provide any Bernoulli distribution functions. For that reason, we need to install and load the Rlab add-on package first:
install.packages("Rlab")                         # Install Rlab package
library("Rlab")                                  # Load Rlab package
Then, we need to create a vector of quantiles in R:
x_dbern <- seq(0, 10, by = 1) # Specify x-values for dbern function
We can now apply the dbern function of the Rlab R package to our vector of quantiles in order to return the corresponding values of the Bernoulli PDF:
y_dbern <- dbern(x_dbern, prob = 0.7) # Apply dbern function
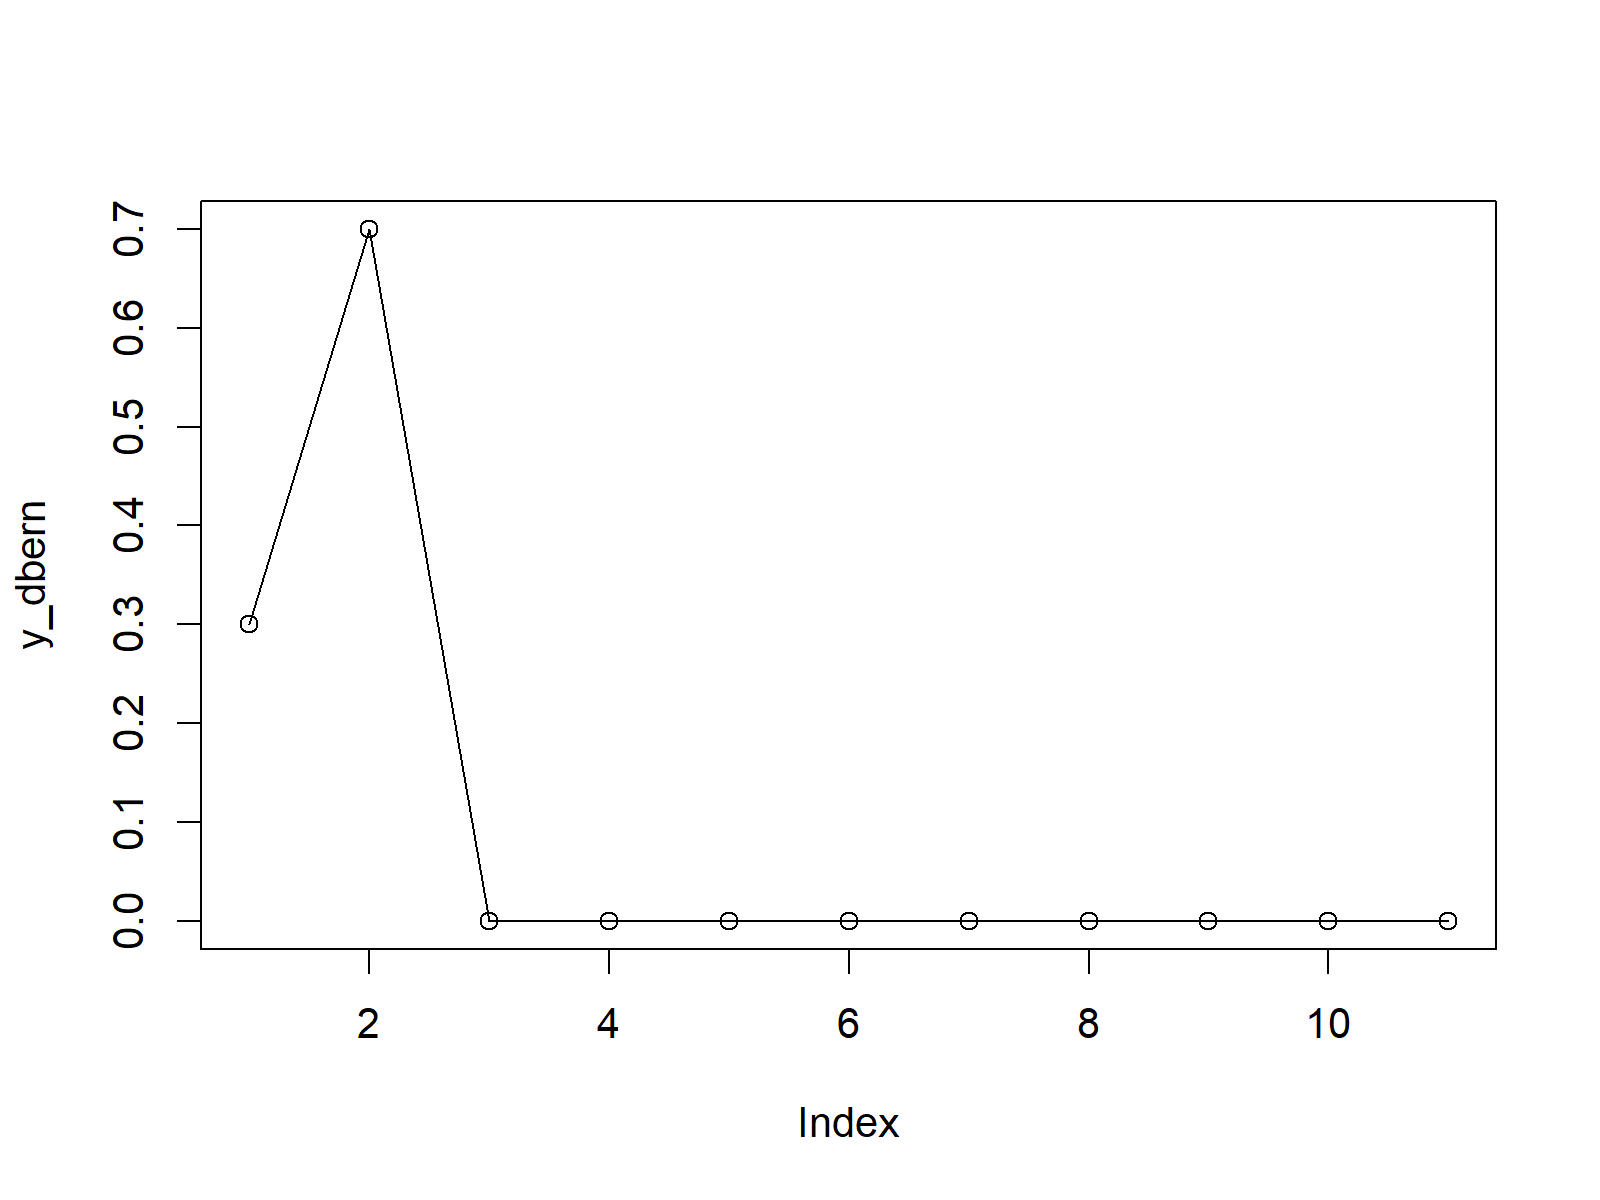
If we want to draw a graphic of this distribution, we can apply the plot function as shown below:
plot(y_dbern, type = "o") # Plot dbern values

Figure 1: PDF of Bernoulli Distribution in R.
Example 2: Bernoulli Cumulative Distribution Function (pbern Function)
The R syntax for the cumulative distribution function of the Bernoulli distribution is similar as in Example 1. First, we have to create a vector of quantiles:
x_pbern <- seq(0, 10, by = 1) # Specify x-values for pbern function
Then, we can apply the pbern function to this vector:
y_pbern <- pbern(x_pbern, prob = 0.7) # Apply pbern function
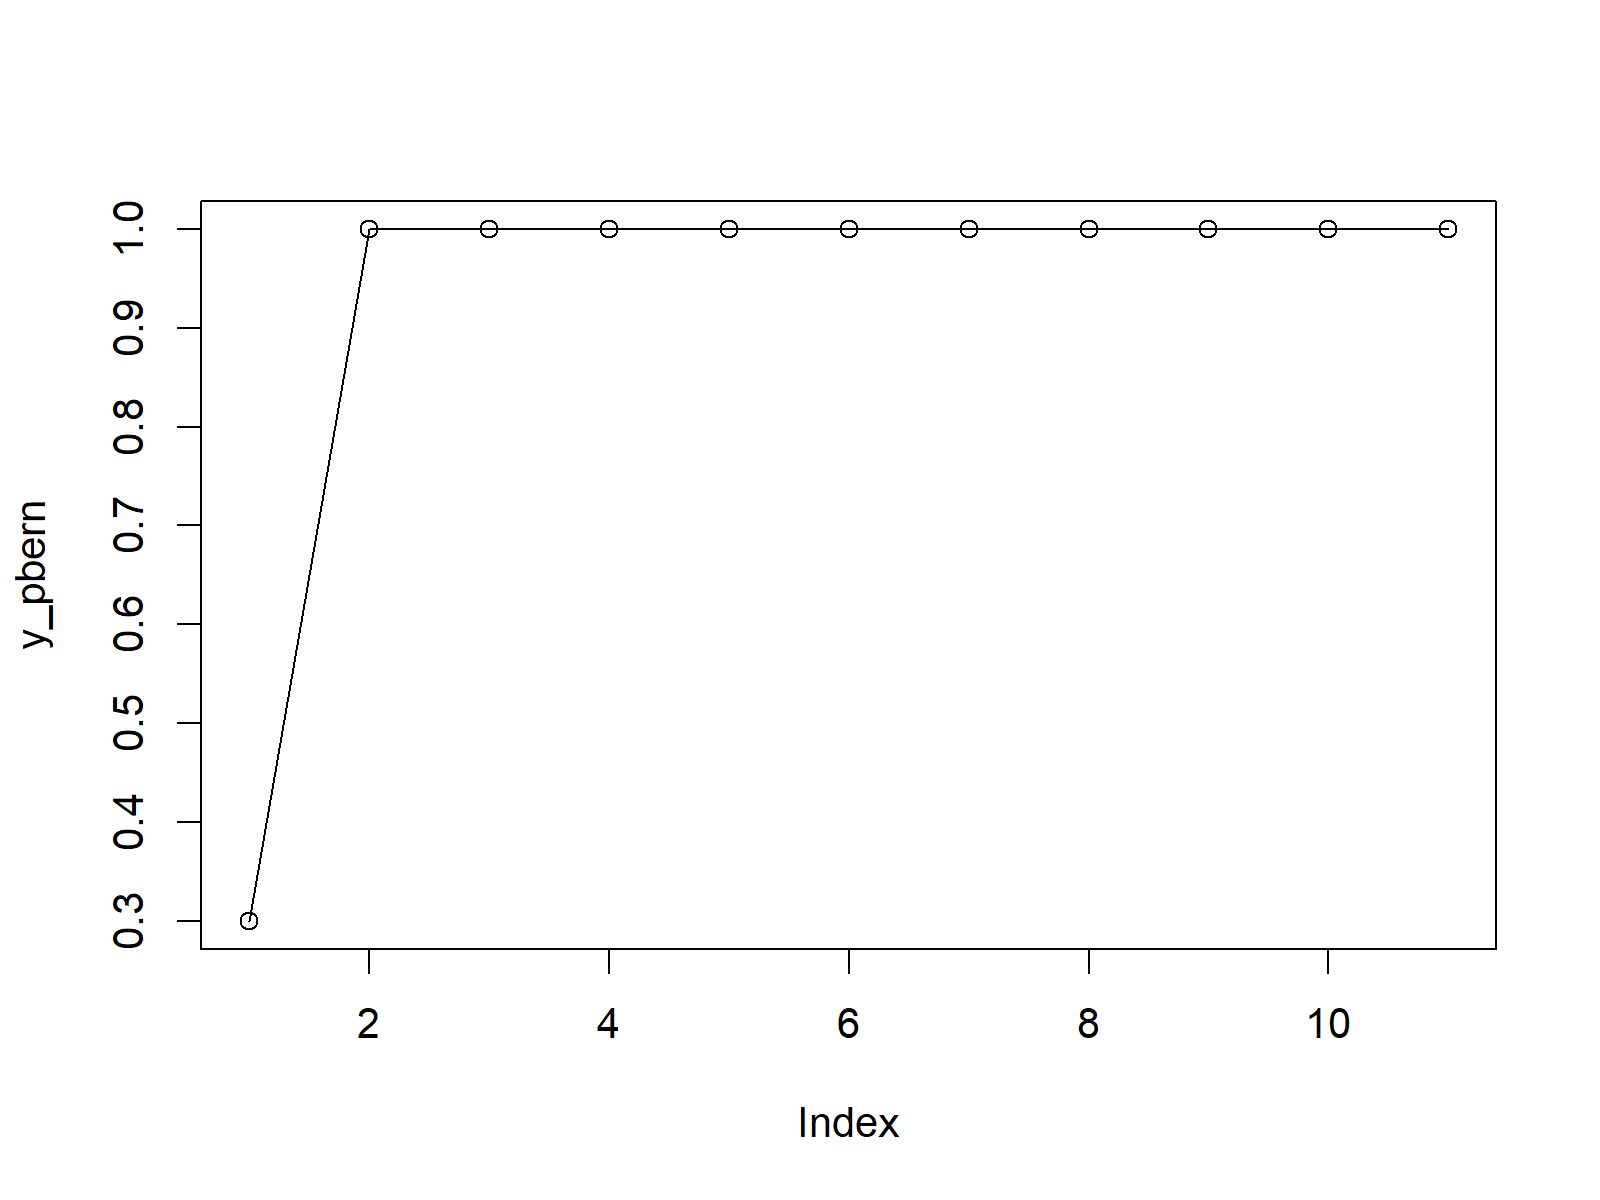
And finally, we can create a graph of the output of pbern with the plot function:
plot(y_pbern, type = "o") # Plot pbern values

Figure 2: CDF of Bernoulli Distribution in R.
Example 3: Bernoulli Quantile Function (qbern Function)
Example 3 shows how to create a graphic of the quantile function of the Bernoulli distribution. As a first step, we have to create a sequence of probabilities (i.e. values between 0 and 1):
x_qbern <- seq(0, 1, by = 0.1) # Specify x-values for qbern function
We can now use the qbern function to get the corresponding quantile function values for our probabilities:
y_qbern <- qbern(x_qbern, prob = 0.7) # Apply qbern function
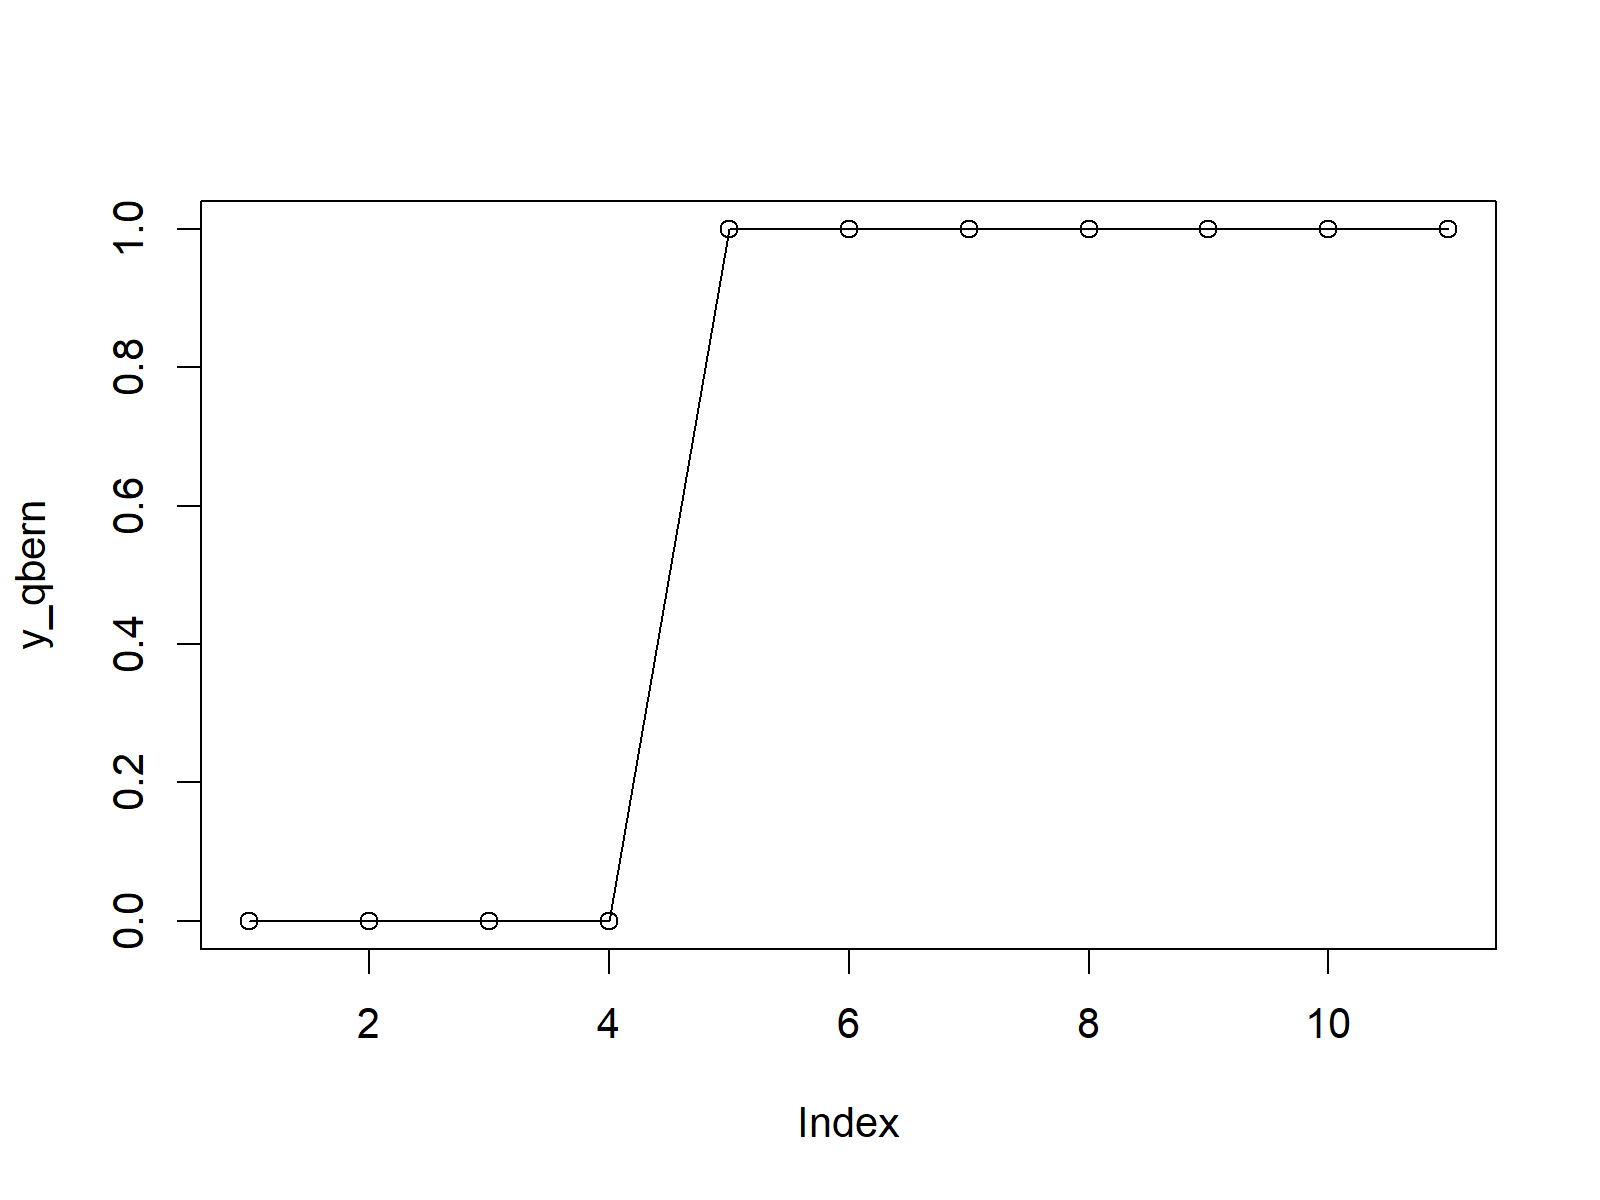
The corresponding plot can be drawn with the plot function:
plot(y_qbern, type = "o") # Plot qbern values

Figure 3: Quantile Function of Bernoulli Distribution in R.
Example 4: Generating Random Numbers (rbern Function)
To generate a set of random numbers with a Bernoulli distribution, we need to specify a seed and a sample size N first:
set.seed(98989)                                  # Set seed for reproducibility
N <- 10000                                       # Specify sample size
Then, we can apply the rbern function to create N Bernoulli distributed random numbers:
y_rbern <- rbern(N, prob = 0.7)                  # Draw N random values
y_rbern                                          # Print values to RStudio console
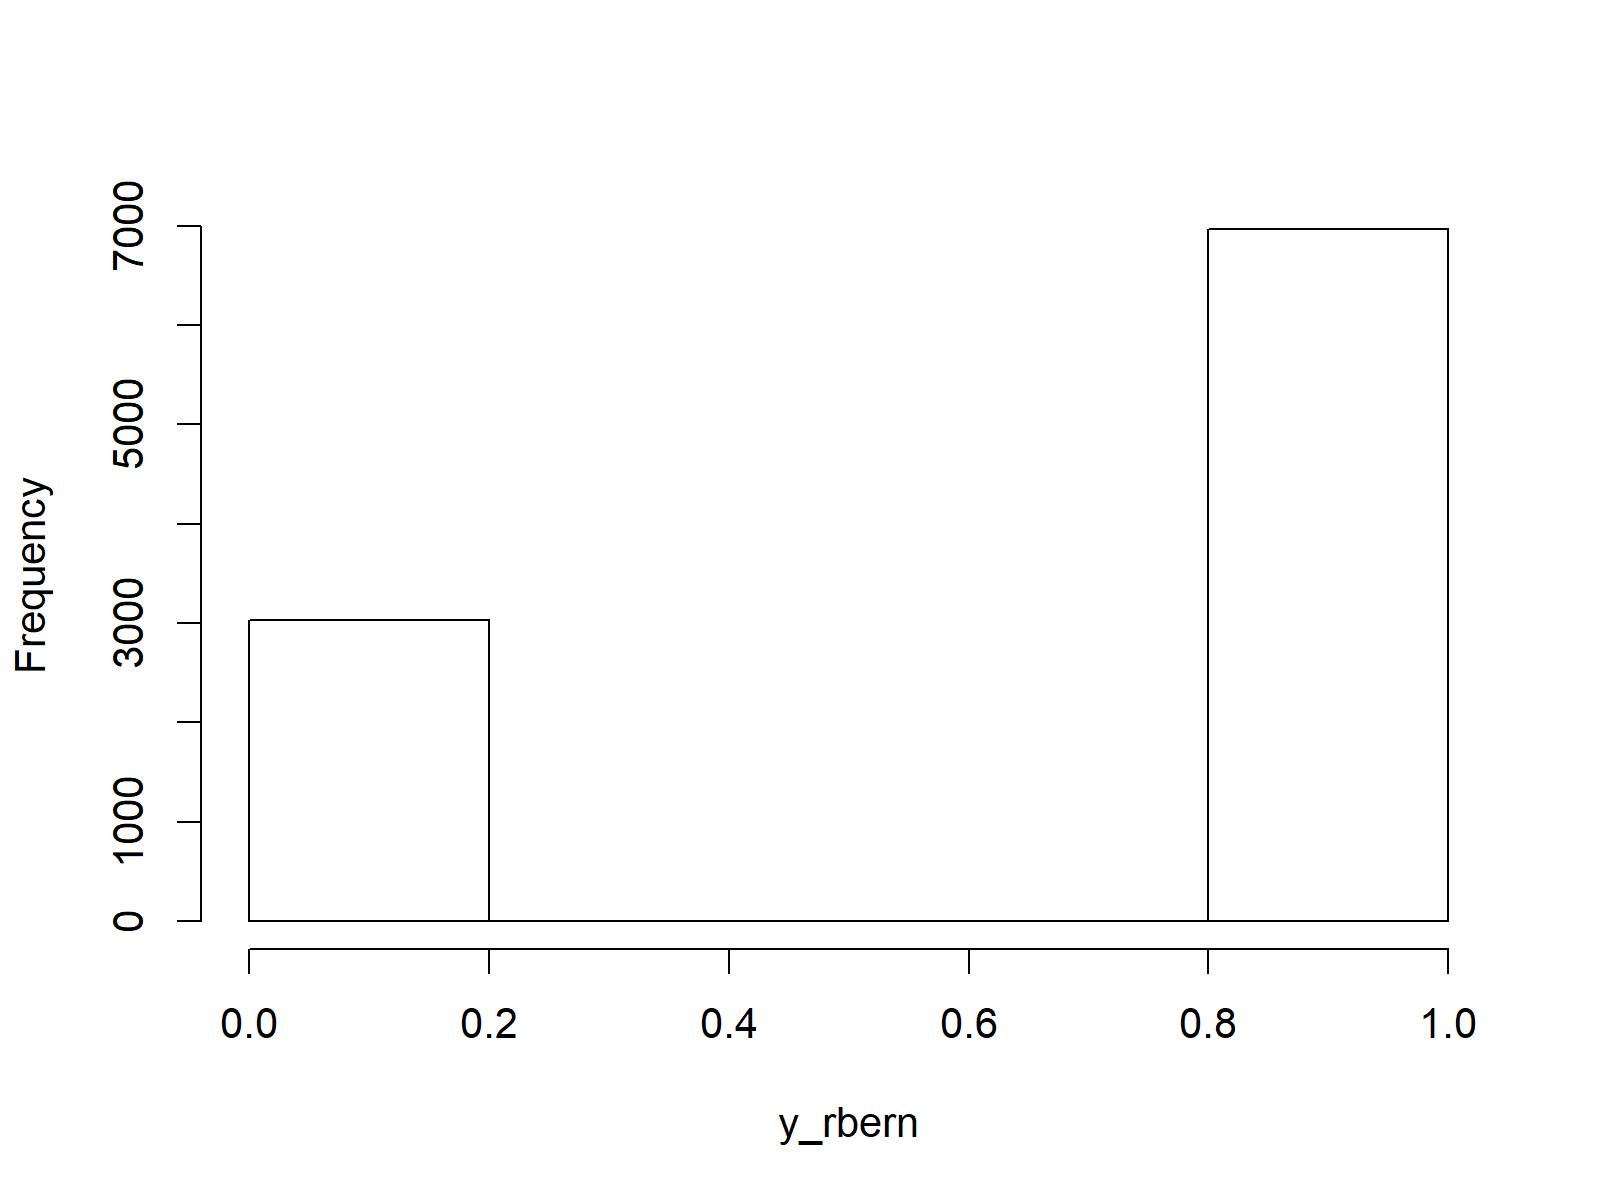
We can illustrate the output of the rbern function with a histogram:
hist(y_rbern,                                    # Plot of randomly drawn density
     breaks = 5,
     main = "")

Figure 4: Randomly Drawn Numbers of Bernoulli Distribution in R.
Video, Further Resources & Summary
If you need further info on the R codes of this tutorial, you may watch the following video of my YouTube channel. I illustrate the R syntax of this page in the video:
The YouTube video will be added soon.
You may also have a look at the other tutorials on distributions and the simulation of random numbers in R:
- Bernoulli Distribution in R
- Beta Distribution in R
- Binomial Distribution in R
- Bivariate & Multivariate Distributions in R
- Cauchy Distribution in R
- Chi-Squred Distribution in R
- Exponential Distribution in R
- F Distribution in R
- Gamma Distribution in R
- Geometric Distribution in R
- Hypergeometric Distribution in R
- Log Normal Distribution in R
- Logistic Distribution in R
- Negative Binomial Distribution in R
- Normal Distribution in R
- Poisson Distribution in R
- Student t Distribution in R
- Studentized Range Distribution in R
- Uniform Distribution in R
- Weibull Distribution in R
- Wilcoxon Signedank Statistic Distribution in R
- Wilcoxonank Sum Statistic Distribution in R
In addition, I can recommend to have a look at some of the related tutorials of my homepage.
This article showed how to use the dbern, pbern, qbern, and rbern functions of the Rlab package in the R programming language. Let me know in the comments below, if you have additional questions. Furthermore, don’t forget to subscribe to my email newsletter for regular updates on the newest articles.


