Change Position of ggplot Title in R (4 Examples) | Adjust to Center, Right-Aligned or Vertical Positioning
This article explains how to adjust the title position of a ggplot in R. The tutorial will be structured as follows:
- Example Data & Default Specification
- Center Title of ggplot (Example 1)
- Right-align Title of ggplot (Example 2)
- Adjust ggplot Title Vertically (Example 3)
- Show Title within Plot Area (Example 4)
- Further Resources for Handling ggplot2
Let’s move directly to the R syntax!
Creating Example Data
Before we can start with the examples, we need to create some data first:
set.seed(345)                                       # Set seed
data <- data.frame(x = rnorm(100),                  # x variable
                   y = rnorm(100))                  # y variable
head(data)                                          # Print data to console
#             x          y
# 1 -0.78490816 -1.3644688
# 2 -0.27951436 -0.4850855
# 3 -0.16145790  0.8824801
# 4 -0.29059656 -0.1427136
# 5 -0.06753159 -0.9824703
# 6 -0.63352041  0.4800219
Our example data frame contains two variables: An x-variable and a y-variable. Let’s see how a scatterplot of these two variables would look like in ggplot by default.
First, we need to install and load the ggplot2 R package:
install.packages("ggplot2")                         # Install ggplot2 package
library("ggplot2")                                  # Load ggplot2 package
Now, we can create a simple dotplot of our example data as follows:
my_ggplot <- ggplot(data, aes(x, y)) +              # ggplot with default title
  geom_point() +
  ggtitle("My Title")
my_ggplot                                           # Print default ggplot
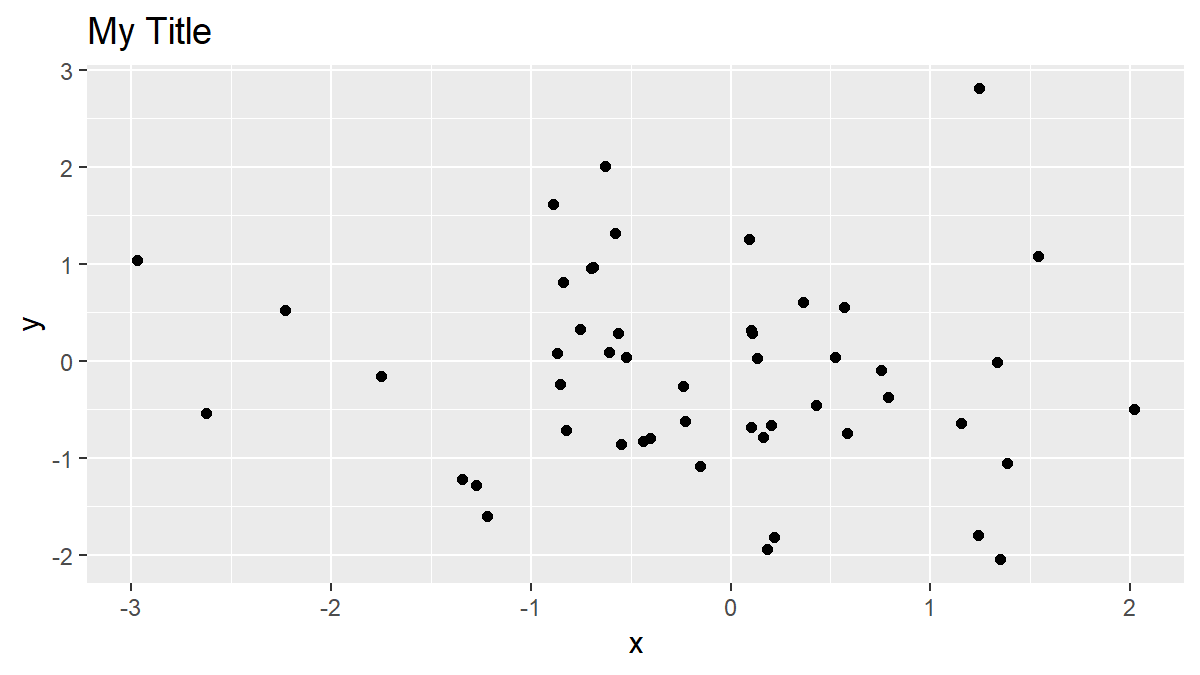
Figure 1: ggplot2 with Default Specification of Plot Title.
As you can see above the plot area: The ggplot2 package automatically left-aligns the plot title.
In the following four examples, I will show you different ways how to modify this automatic positioning manually. So let’s move on to the examples…
Example 1: Center ggplot Title in R
The first example shows how to print the plot title of our ggplot in the middle of our plot. Consider the following R code:
my_ggplot +
  theme(plot.title = element_text(hjust = 0.5))     # Center ggplot title
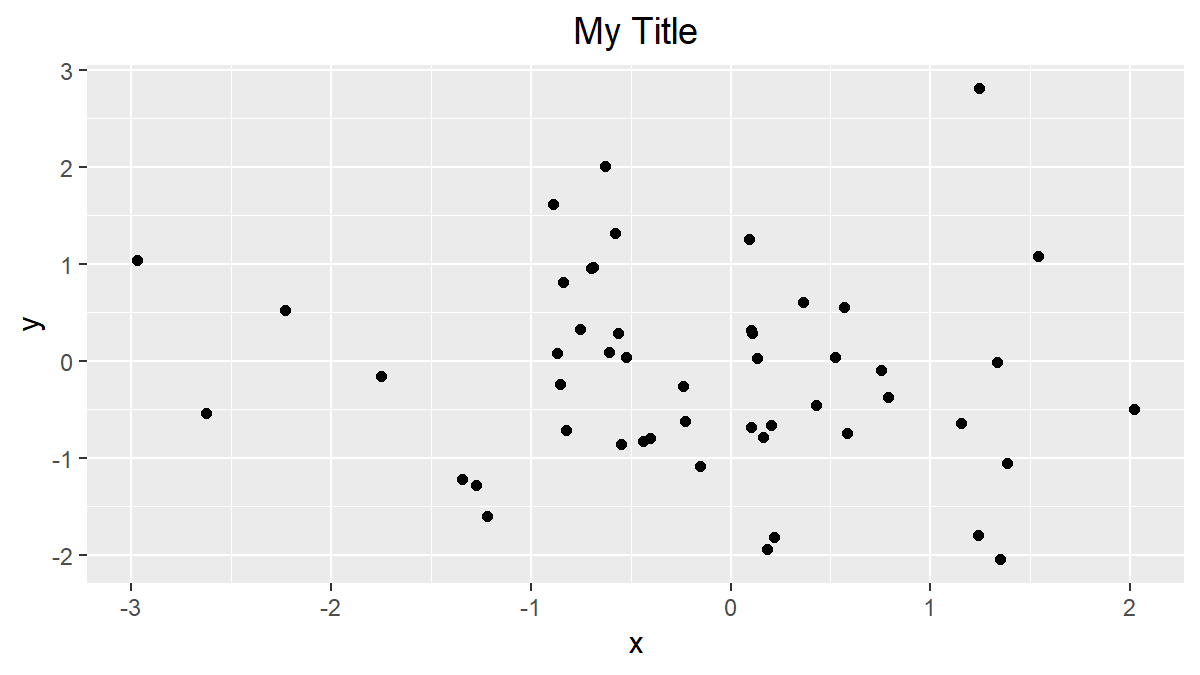
Figure 2: Centered Plot Title.
The previous code changed the position from the left to the middle of our plot. We only had to change the horizontal adjustment of our plot to 0.5 (by specifying hjust = 0.5 within the element_text function).
Of cause, we can also conduct other horizontal adjustments, as you will see in the next example…
Example 2: Right-Align ggplot Title in R
This example explains how to print a ggplot title on the right side of the plot. As in Example 1, we can use the hjust option:
my_ggplot +
  theme(plot.title = element_text(hjust = 1))       # Align title on right side
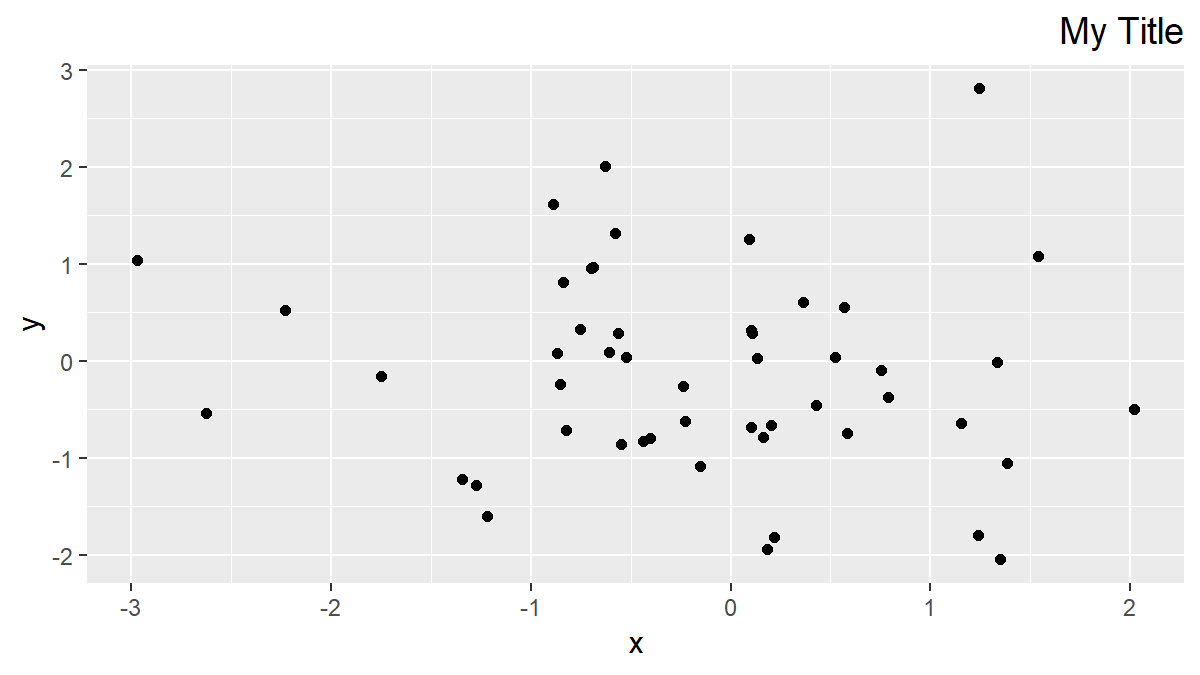
Figure 3: Right-Aligned Plot Title.
We simply had to specify hjust = 1 in order to right-align our plot title. This is due to the reason that in ggplots the hjust range lies between 0 and 1 (i.e. hjust = 0 for left-alignment and hjust = 1 for right-alignment).
Note: This is not only the case for scatterplots (as in our examples). We could adjust the title also for other types of plots such as barcharts, boxplots, histograms and so on…
However, in the next examples you will learn how to vertically change the positioning of ggplot titles. So let’s move on…
Example 3: Adjust ggplot Title Vertically
We can draw our plot title in a vertically higher position with the following R syntax:
my_ggplot +
  theme(plot.title = element_text(vjust = 3))       # Change vertical position
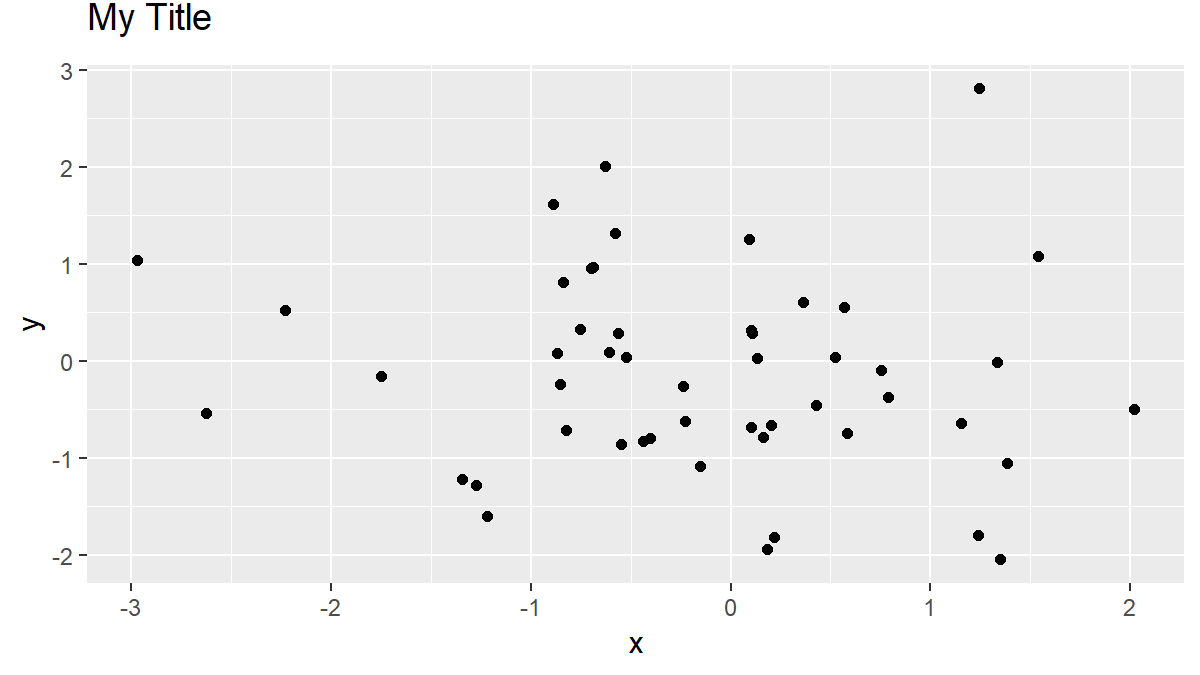
Figure 4: More Space Between Title & Plot.
We simply had to specify a manual vjust (i.e. vertical adjustment) value. The higher the vjust value, the higher we print our plot title.
Note: The plot title is not shown anymore, if vjust is chosen too high. If we want to increase the space between our title and the plot area even more, we also need to adjust the margins of our plot.
Example 4: ggplot Title within Plot
The vjust command can also be used to lower the height of our title position. Consider the following R code:
my_ggplot +
  theme(plot.title = element_text(vjust = - 10))    # Change position downwards
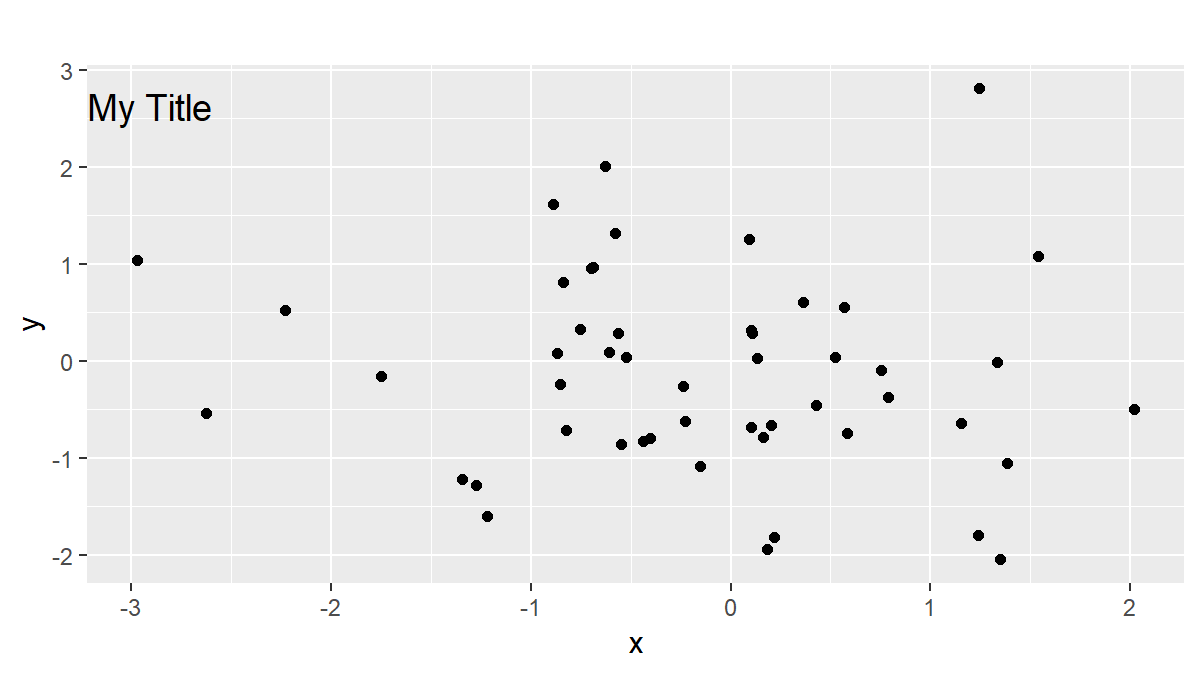
Figure 5: Plot Title within Plot.
As you can see, the plot title was vertically adjusted downwards, so that the title is shown within our plot.
Be careful though: If the content of our plot is show at the same position as our plot title, the title might be difficult to read.
You might therefore also change the color or the size of the title, in case you want to print the title within the plot area.
Tutorial Video & Further Resources for ggplot2
Still have problems on this topic? Check out the video below where I explain the steps of this article more detailed:
Another good video on this topic I can recommend is following YouTube video of the Mr. Math Expert YouTube channel:
Besides the video, you could also have a look at some of the other R programming tutorials of this website. I have published several ggplot2 tutorials already:
- Change ggplot2 Legend Title
- Adjust Space Between ggplot2 Axis Labels and Plot Area
- Remove ggplot2 Legend Entirely
- R Graphics Gallery
- List of R Commands (+ Examples)
- The R Programming Language
In this article, you should have learned how to adjust the position of plot titles in ggplot2. However, in case you have further questions or any other comments, don’t hesitate to let me know in the comment section below!


